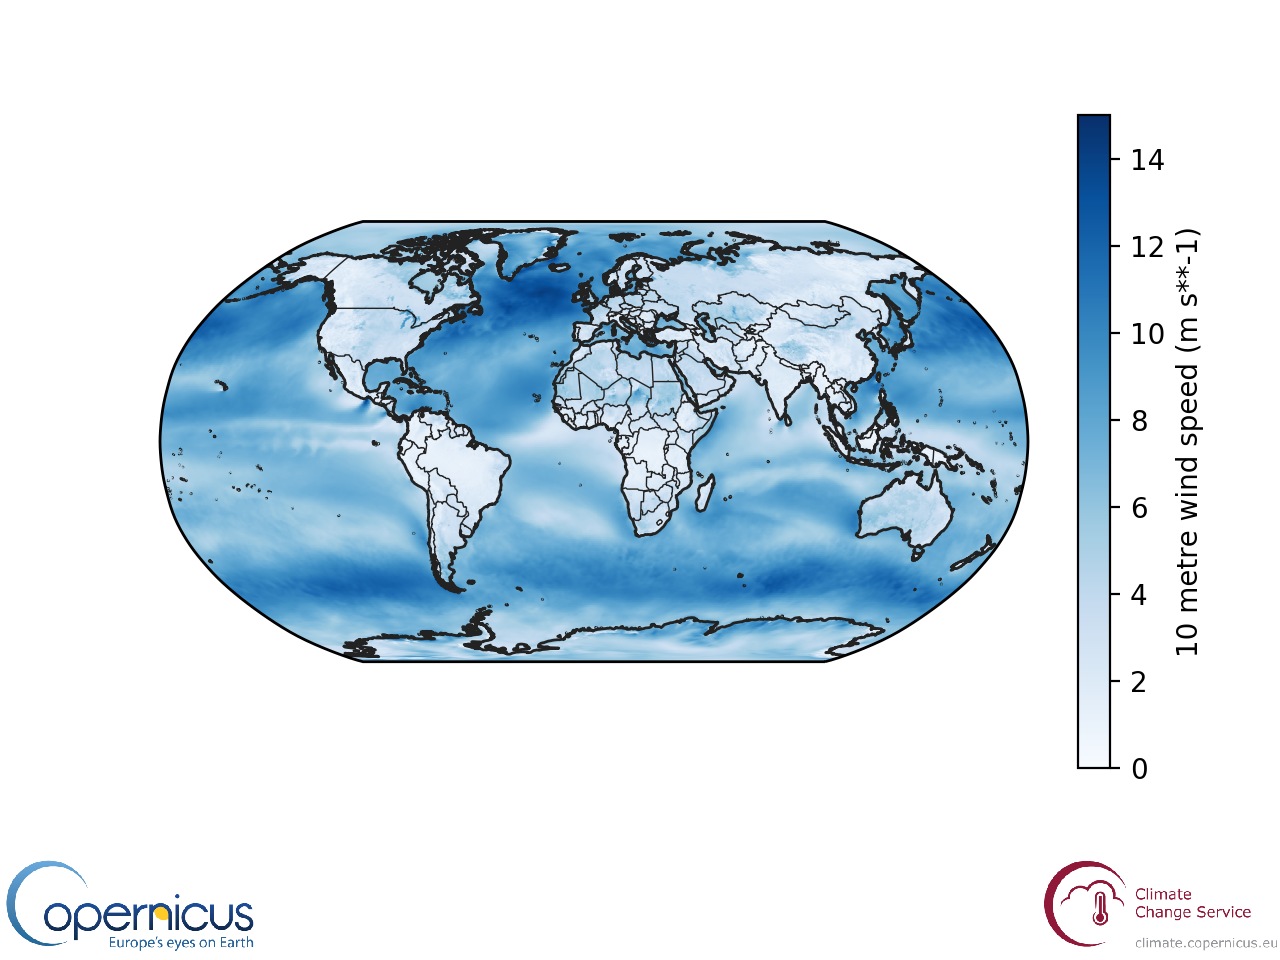
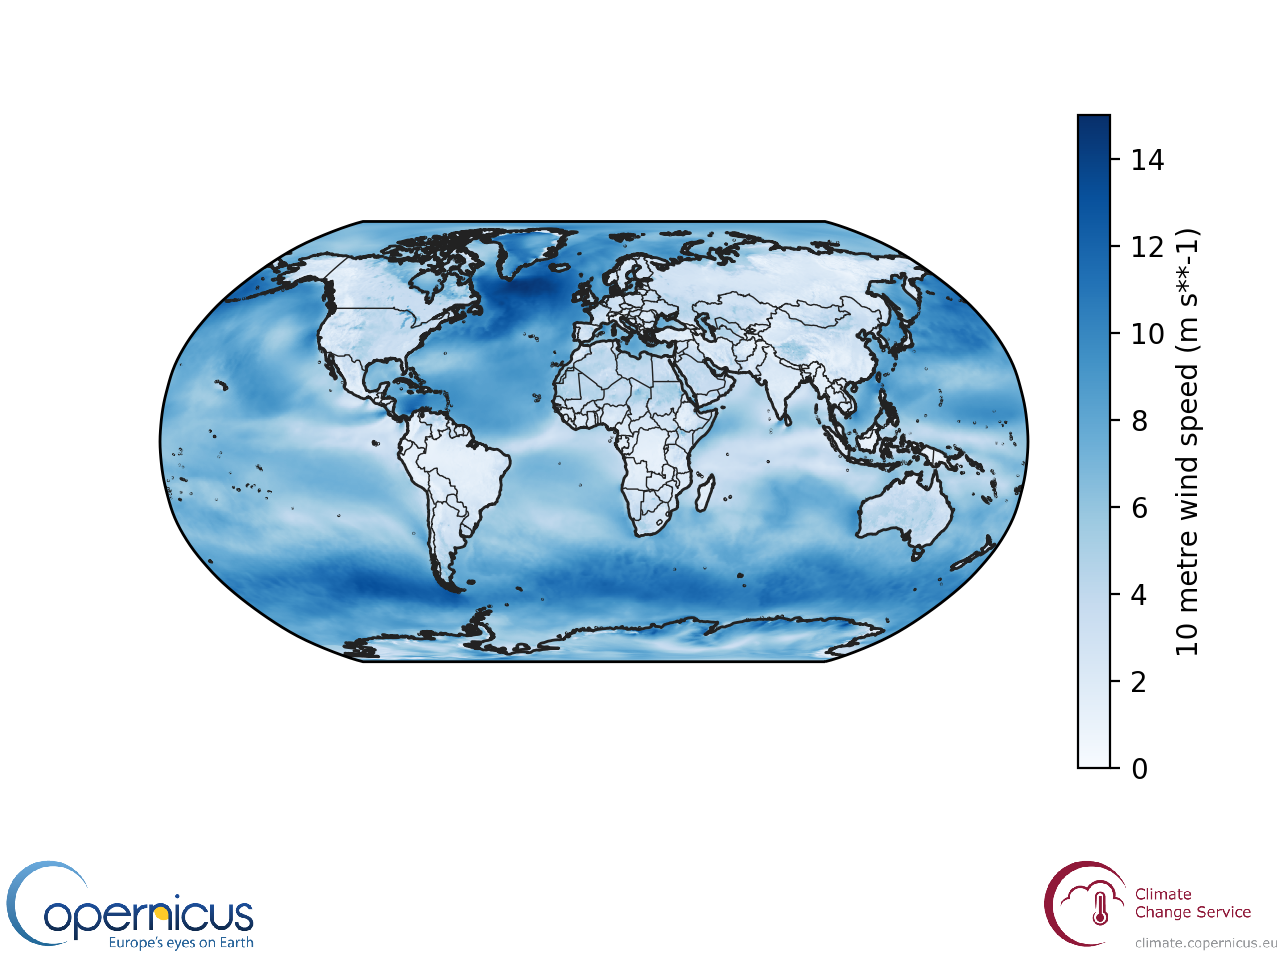
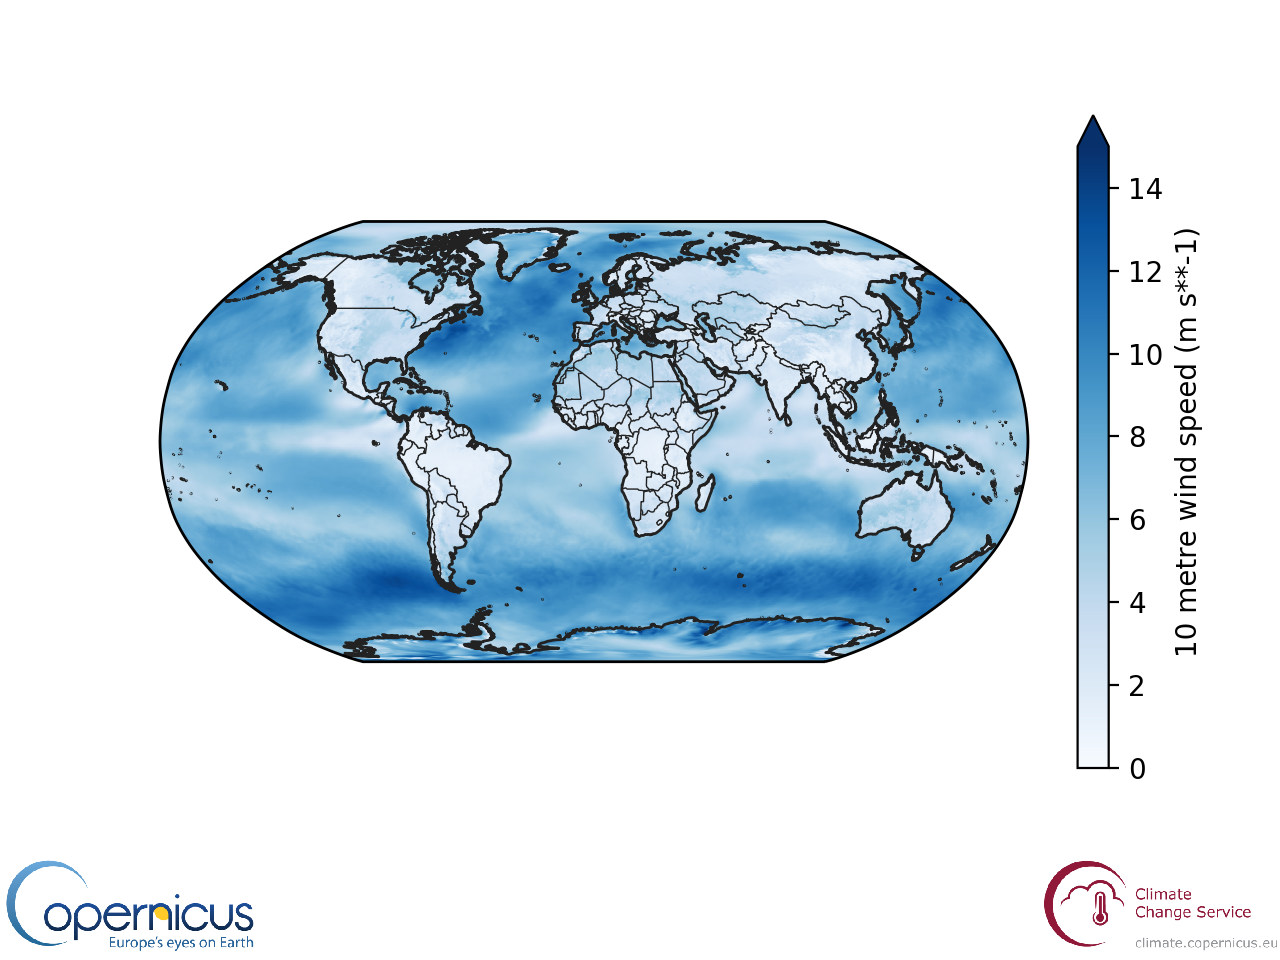
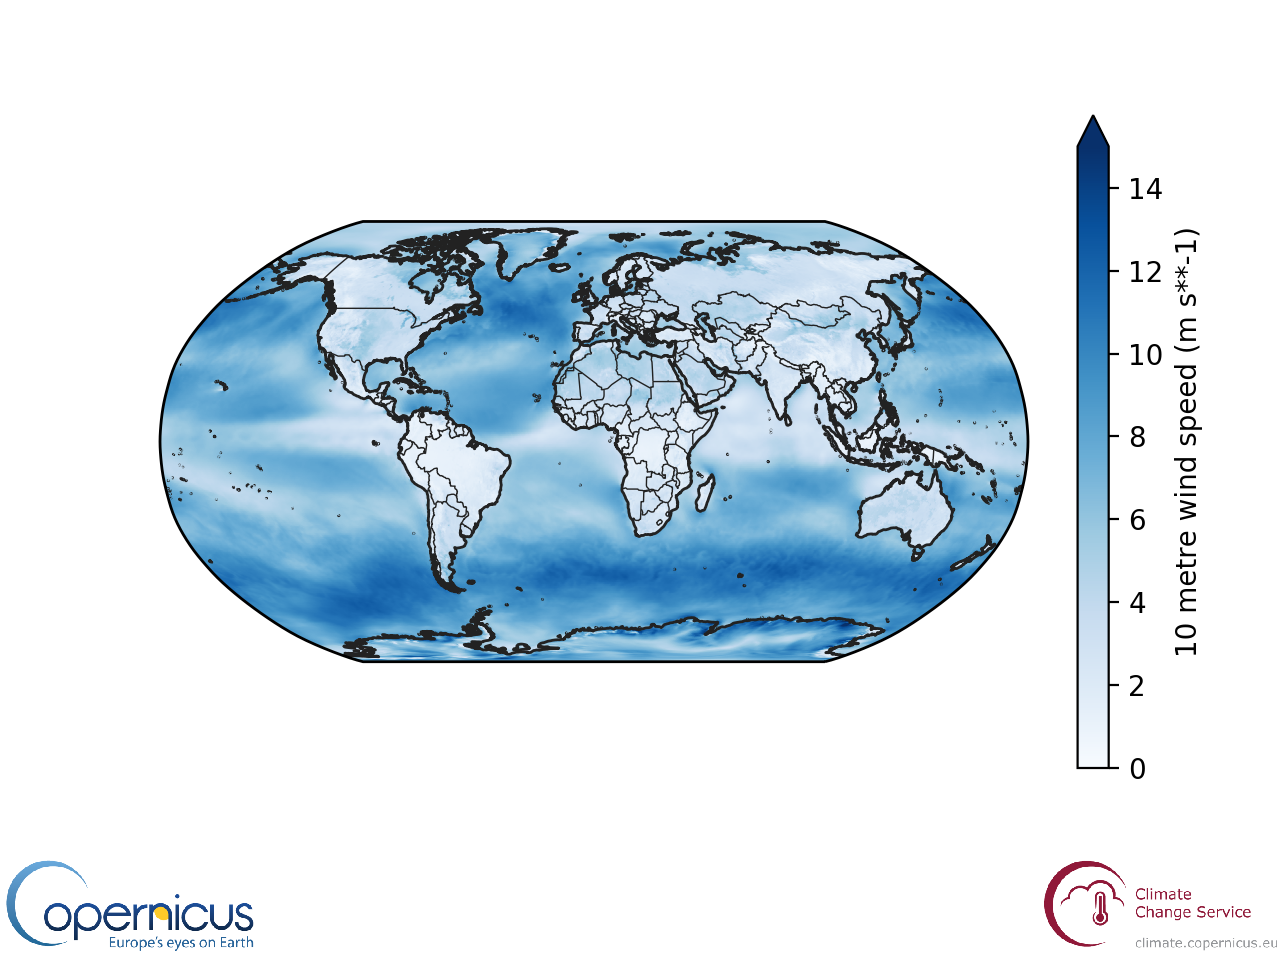

The World's Winds in 2018
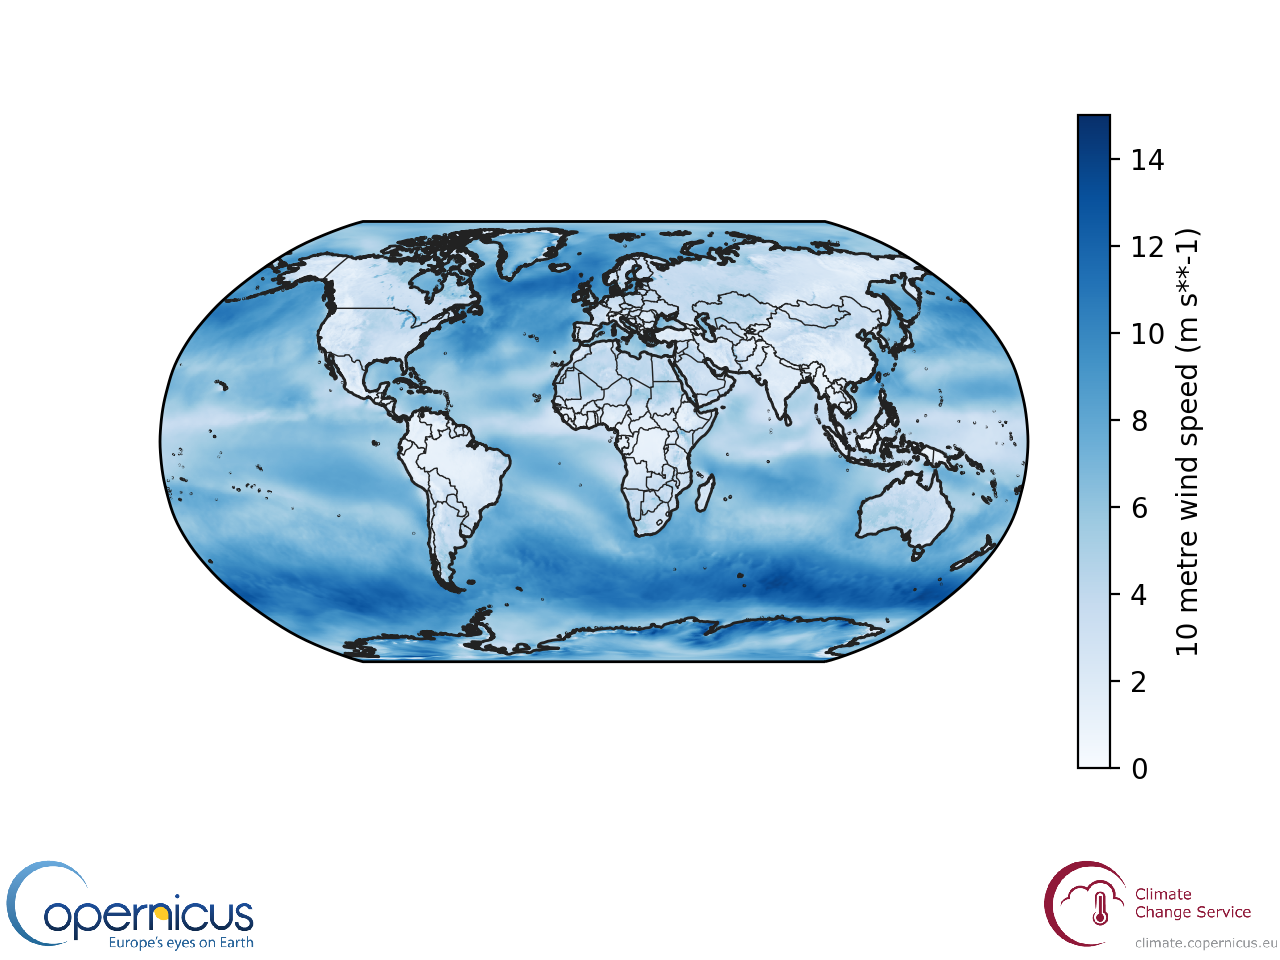
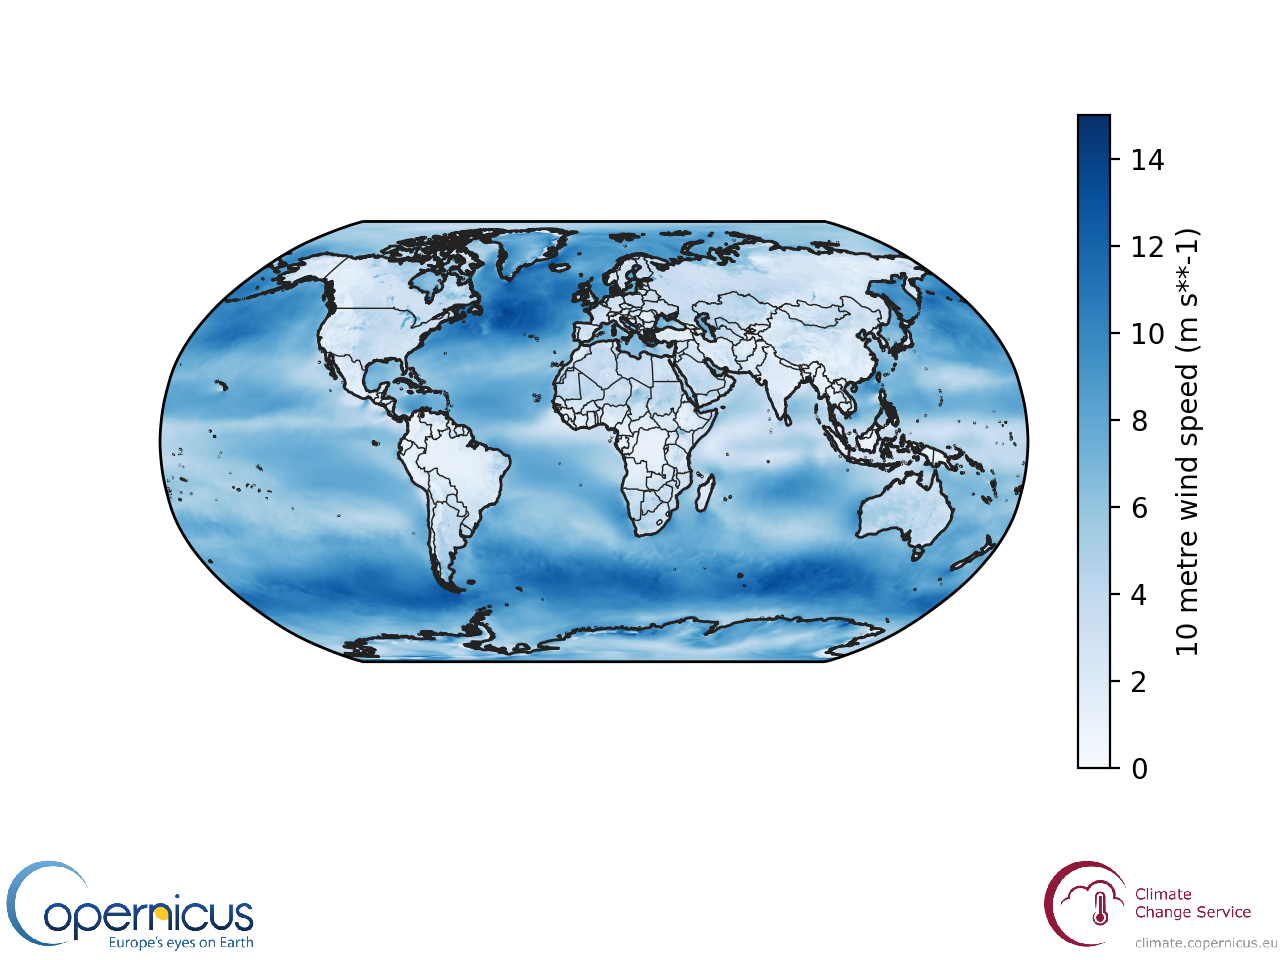
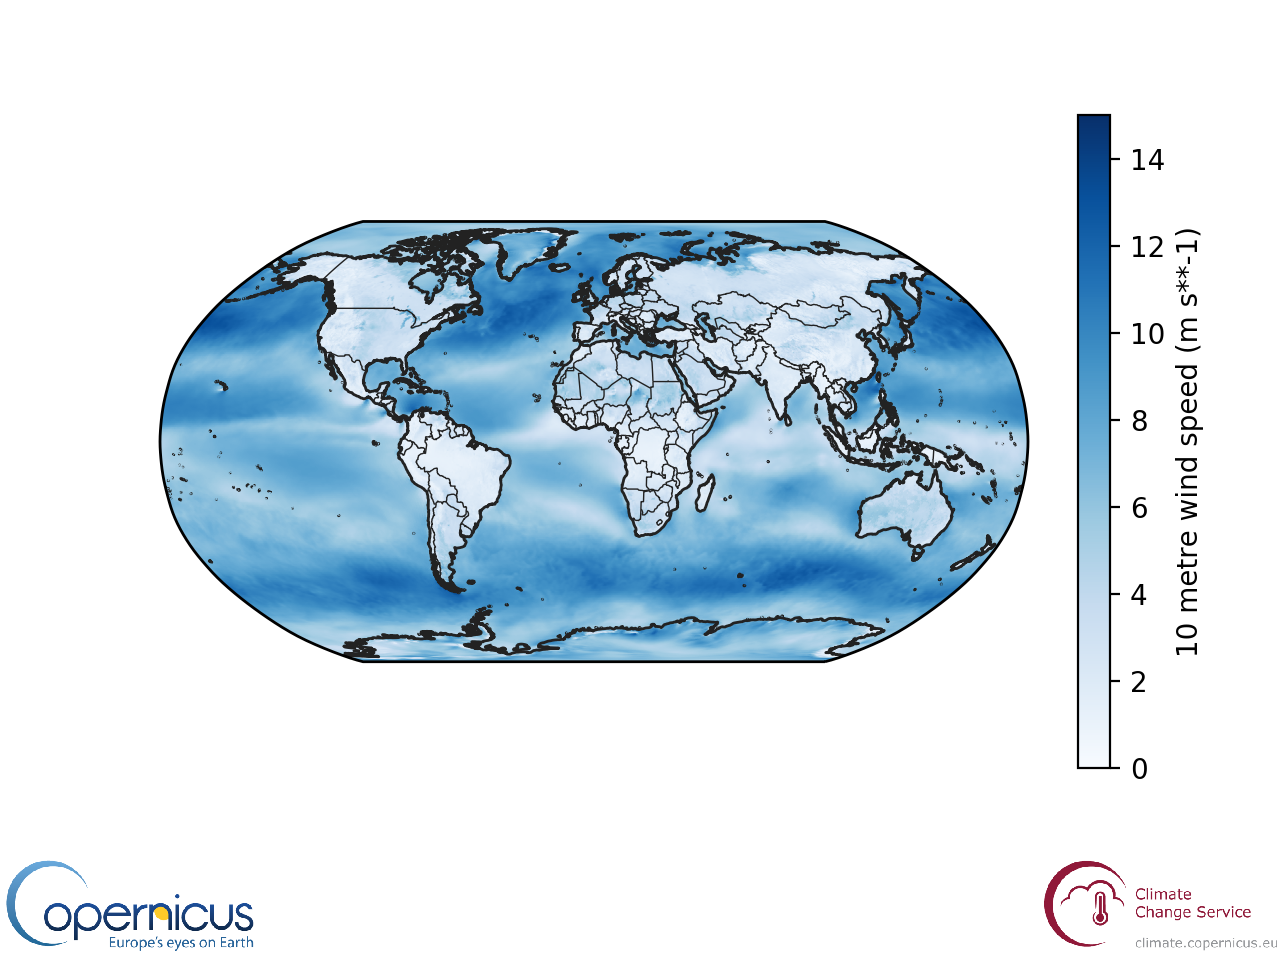
The weather in 2018 was more than just a feature of our environment. The "weather", in the form of wind, supplied around 6% of the world's electicity in 2018, generating tens of billions of dollars in revenue for electricity providers. Browse the maps to see where the winds were strongest. Notce ...
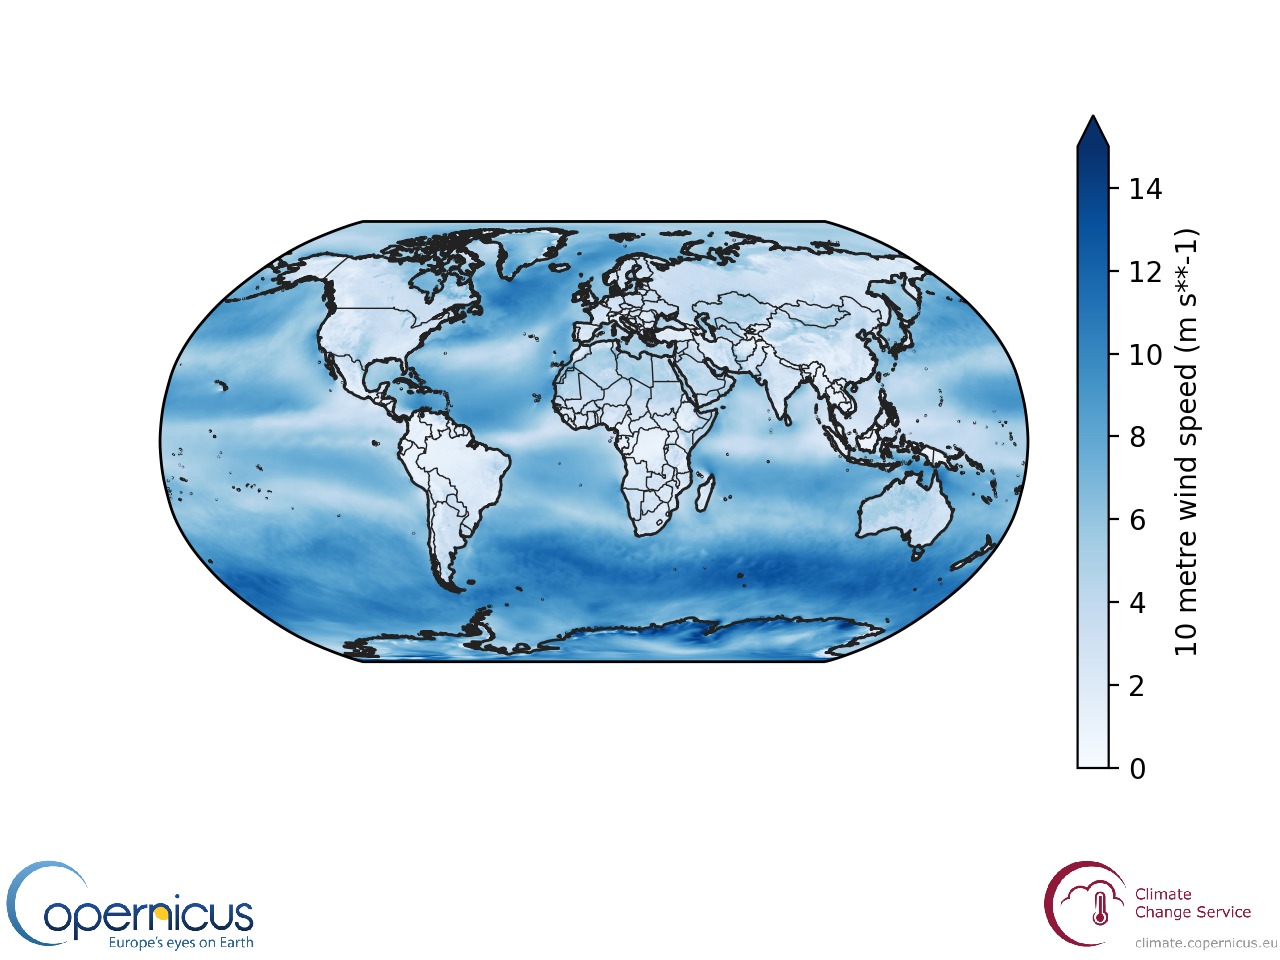
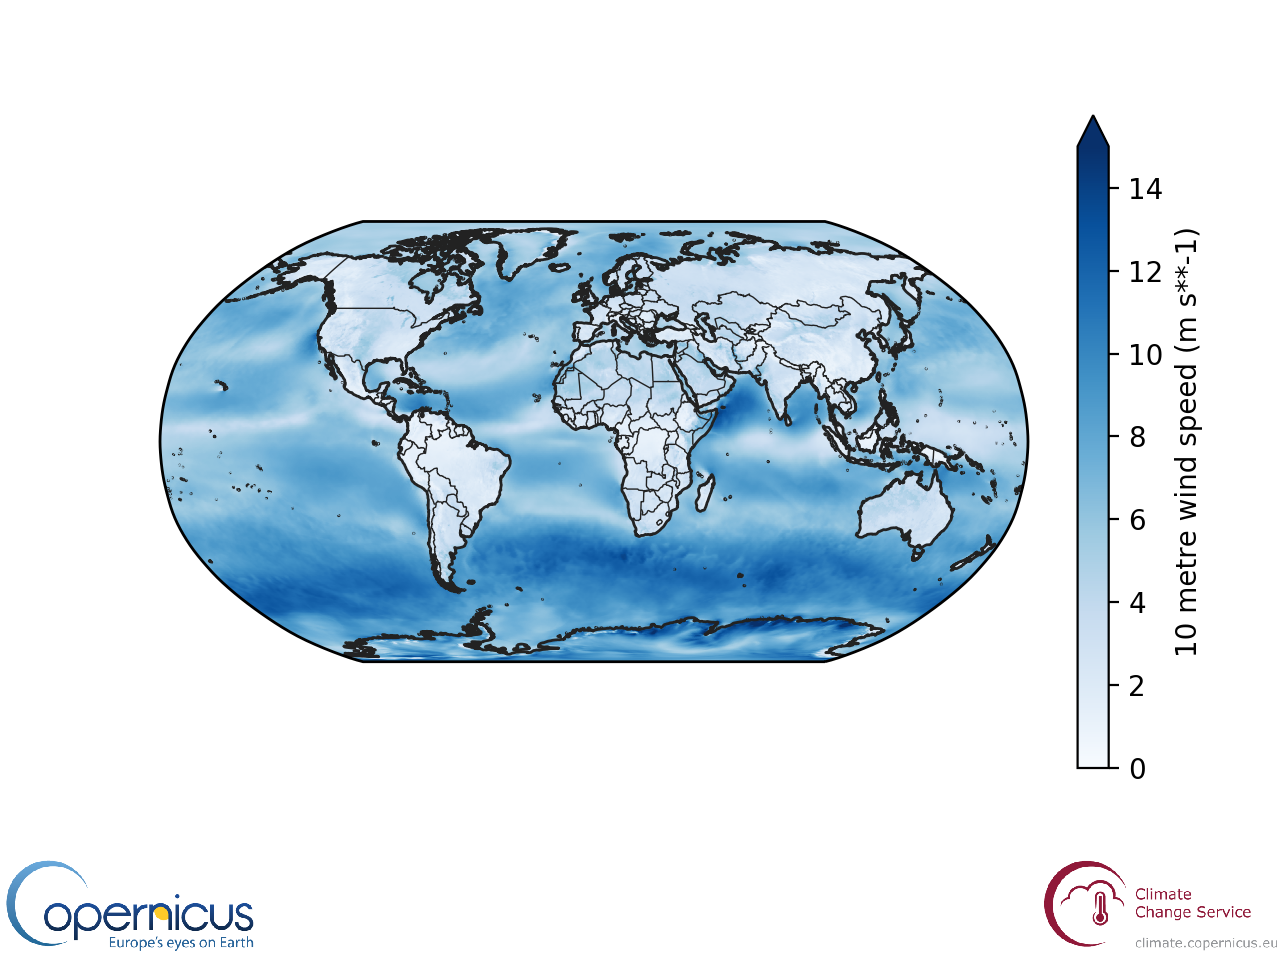
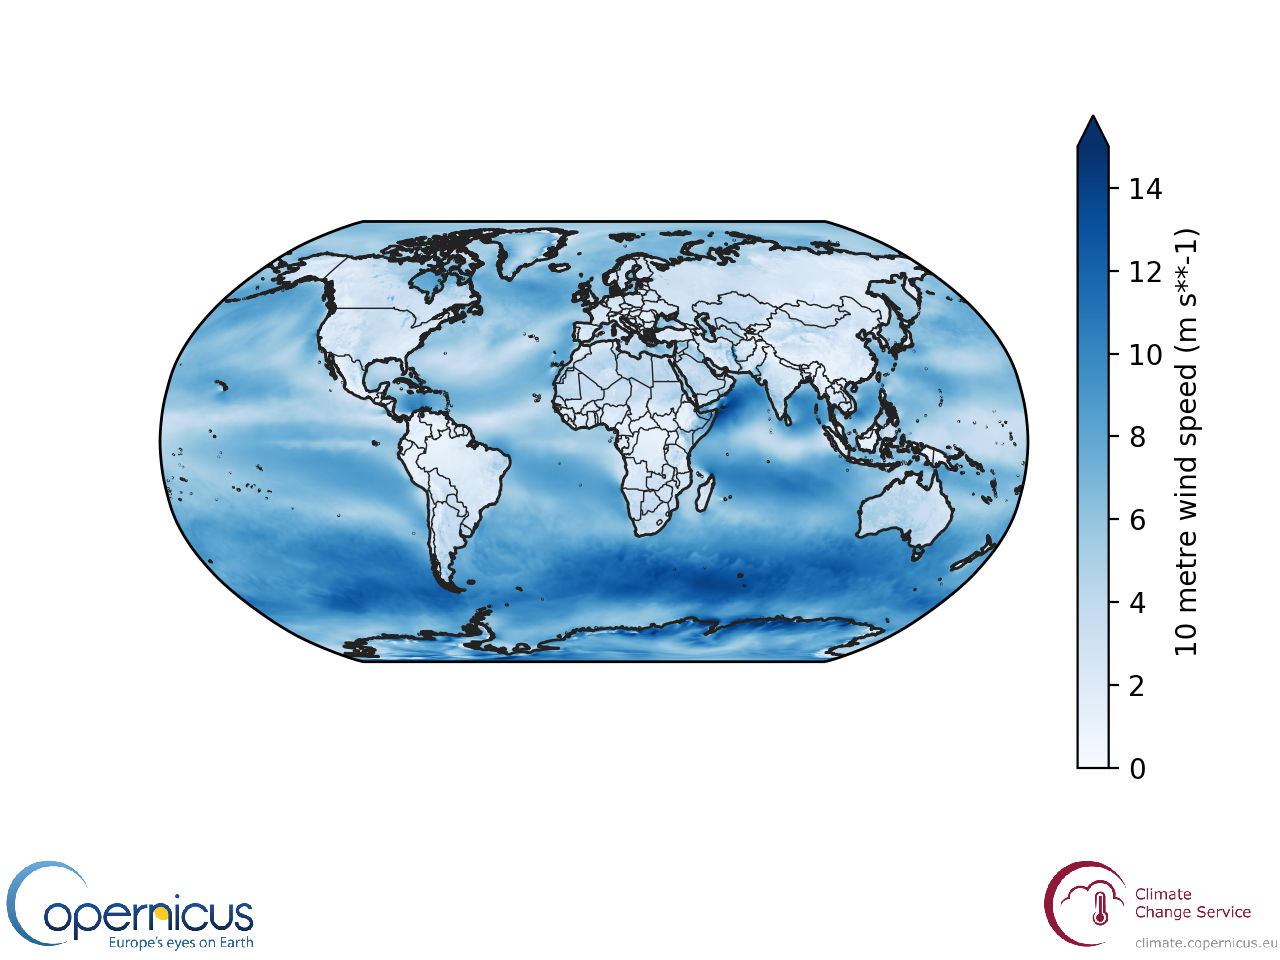
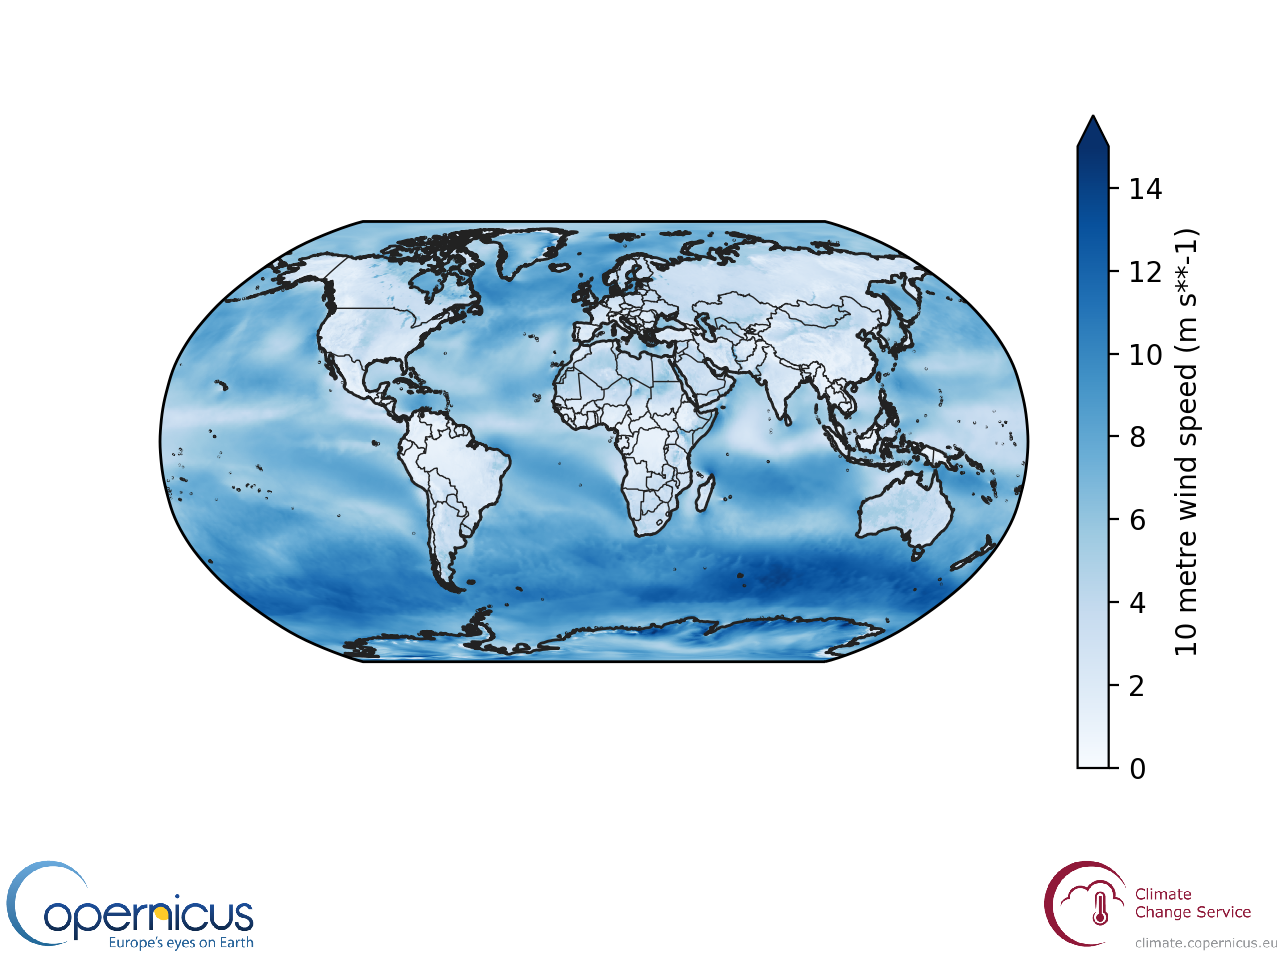
- The "Roaring Forties" of the southern ocean provide consistently strong winds
- Land areas tend to have lighter winds (no wonder wind companies want to build offshore)
- In May and June, bands of weak winds cover the oceans near the equator and around 30 degrees North and South (the horse latitudes)