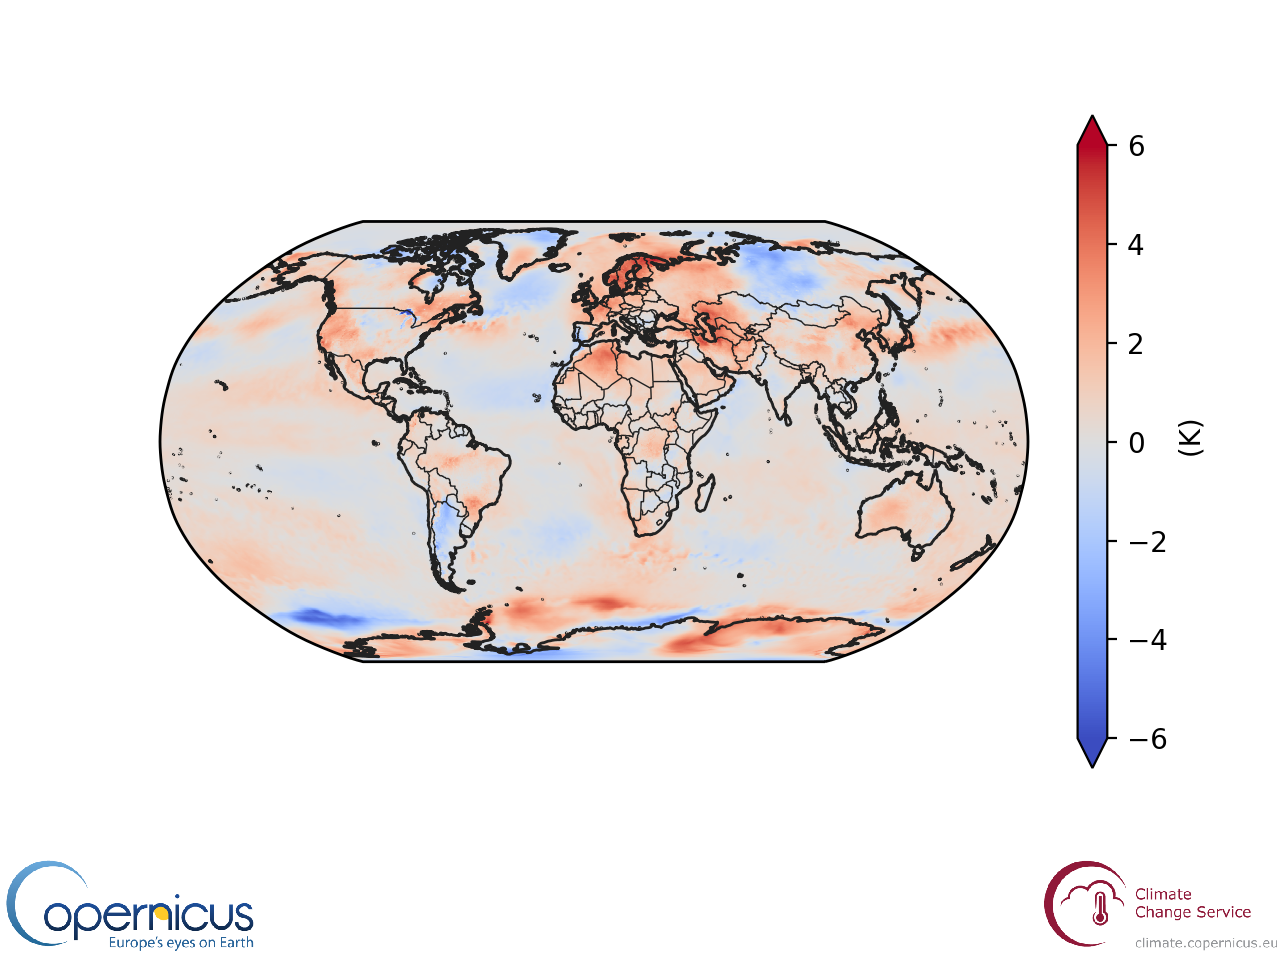
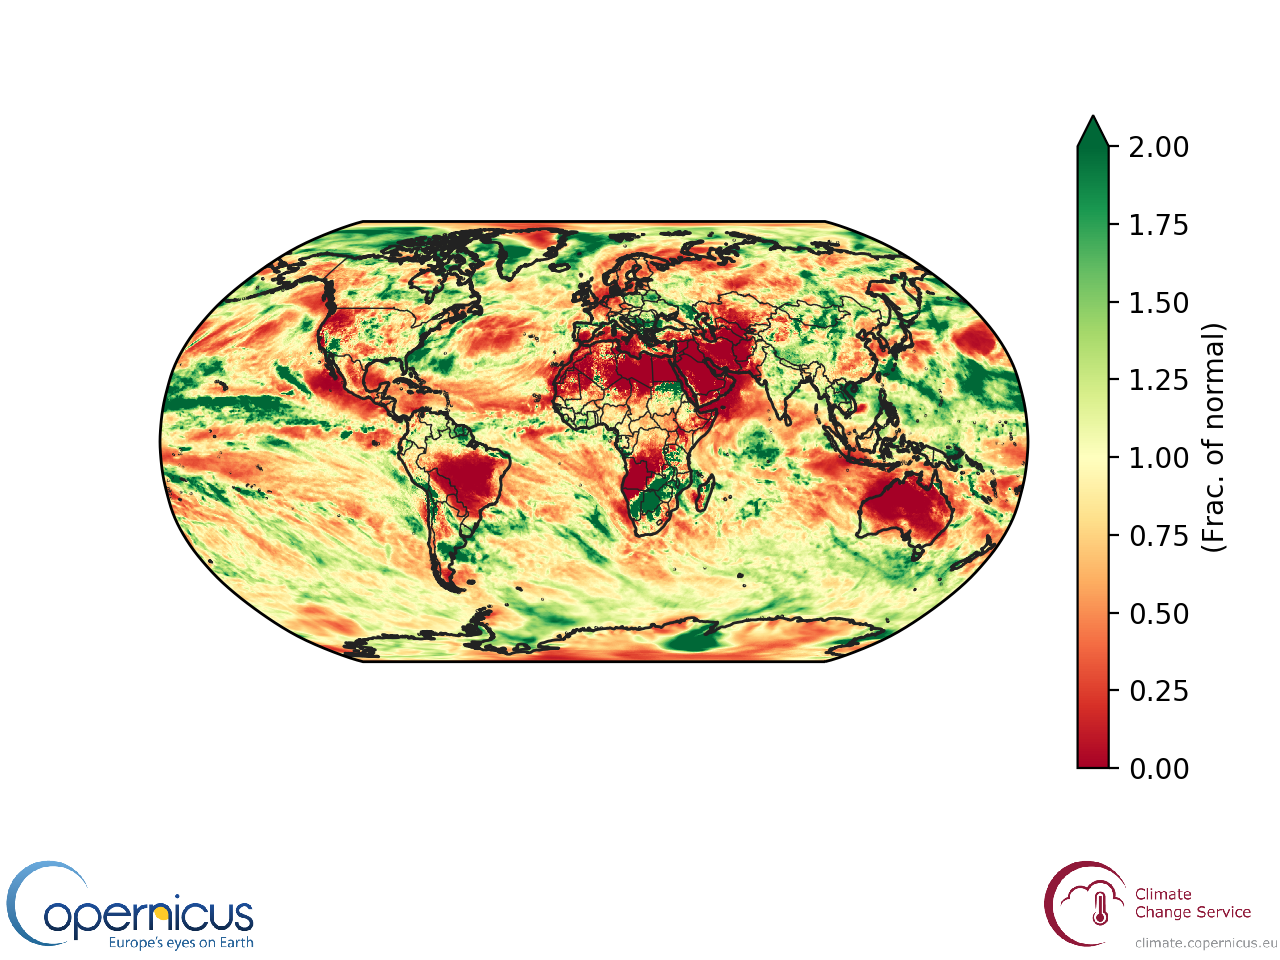
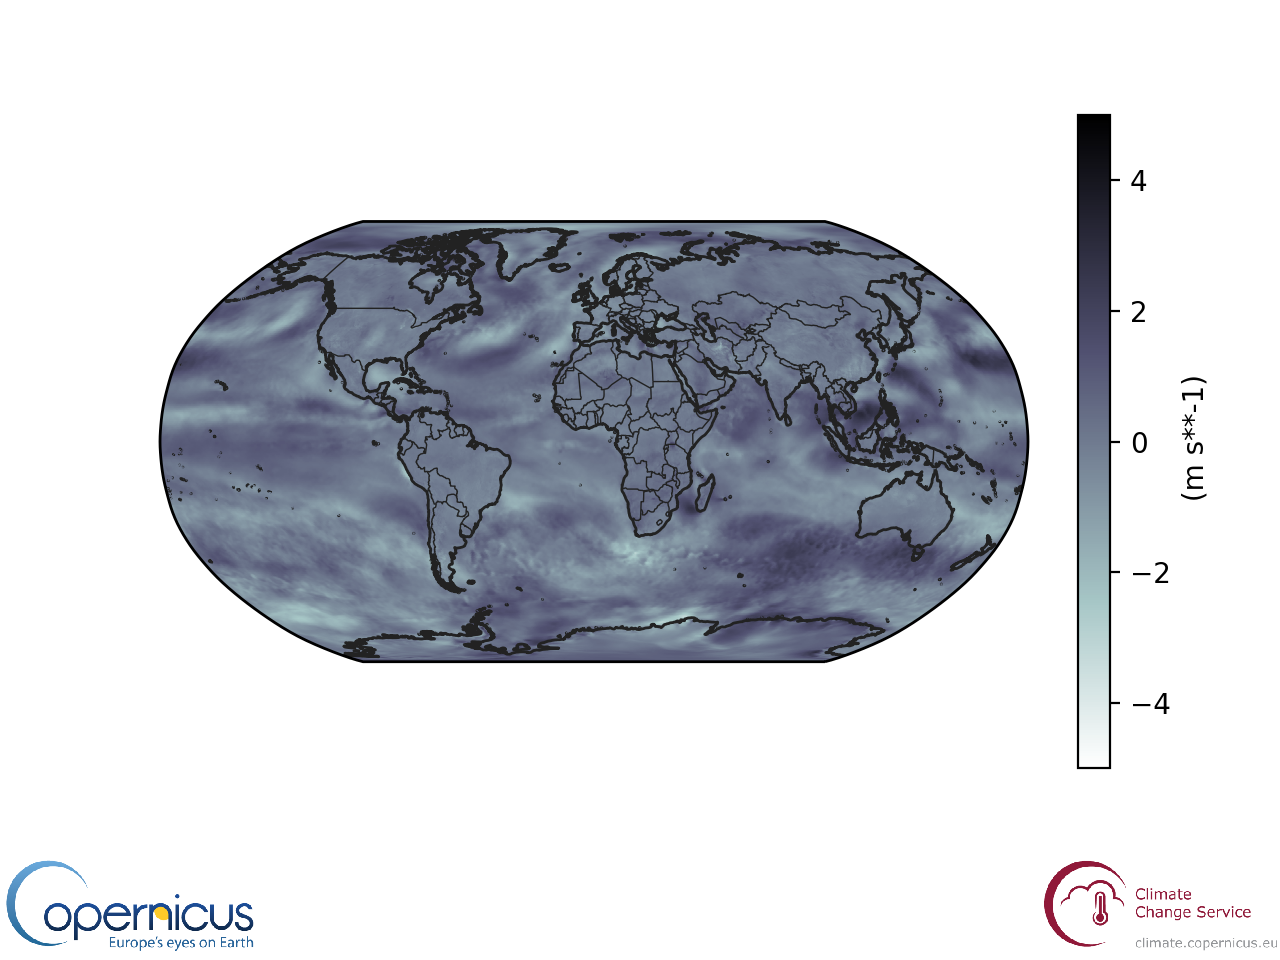
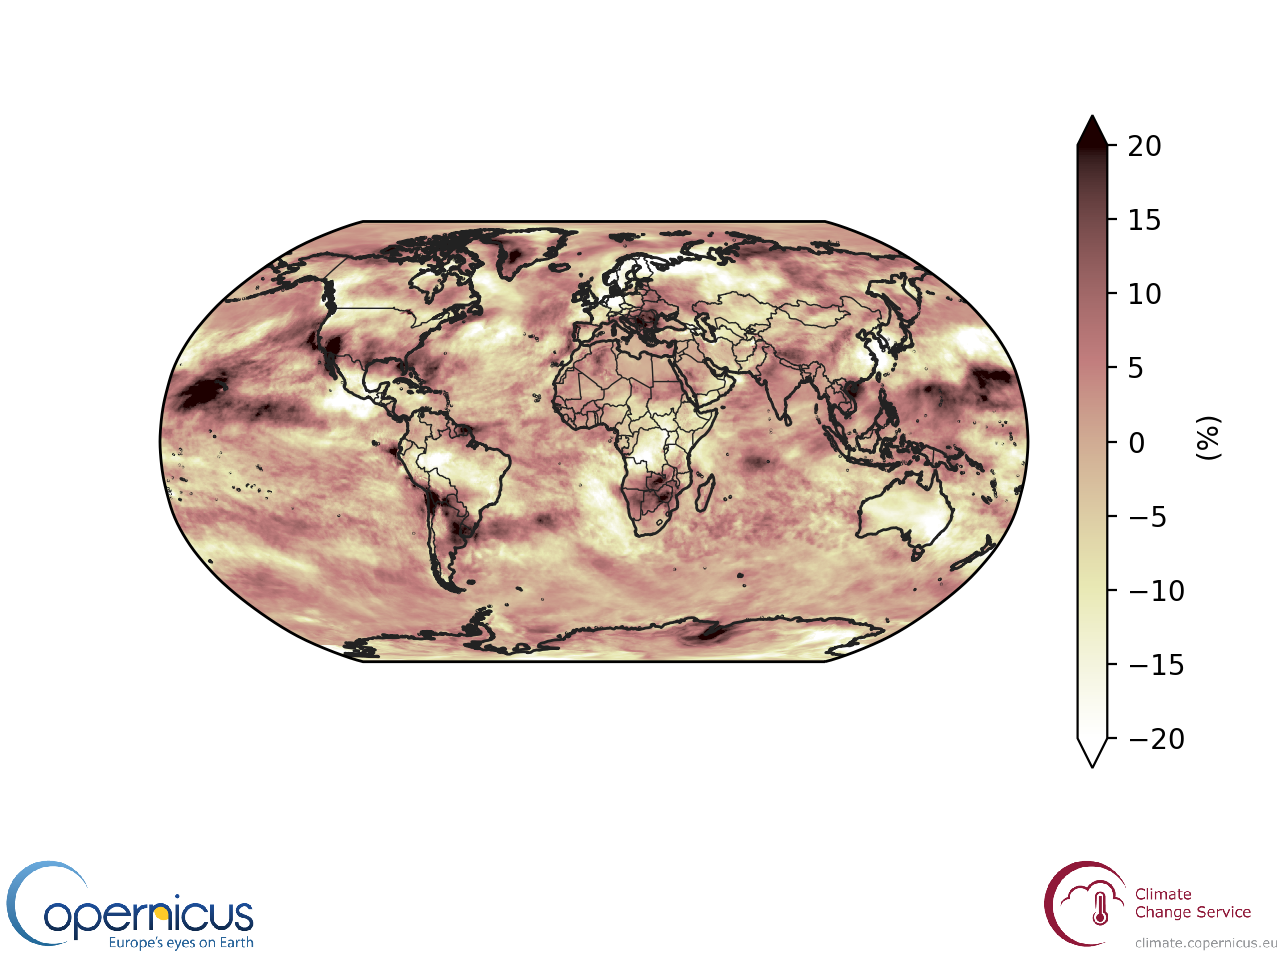
Click through the images below to see temperature, precipitation, wind, and cloudiness anomalies through 2018. Some highlights for each month are given below.

The maps and data are courtesy of the Copernicus Climate Change service.
The data is freely available (with a registered account) through the
Climata Data Store Toolbox. The Toolbox includes a (beta) Python API that lets you generate images, download files, and more with customized data processing.A special thanks to all the scientists and developers whose hard work has made amazing visualizations like these available to the public!
Try it now!