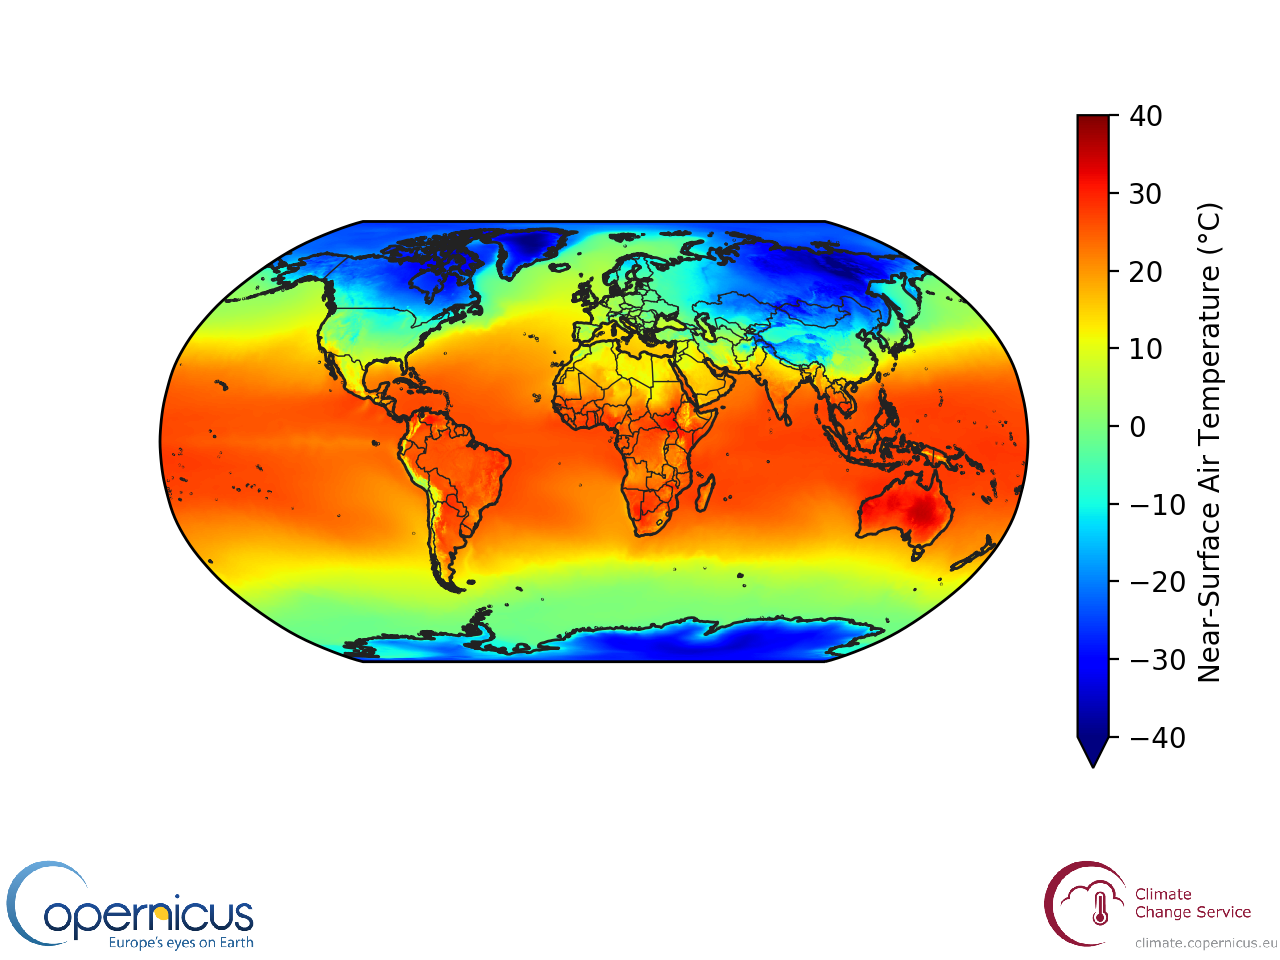
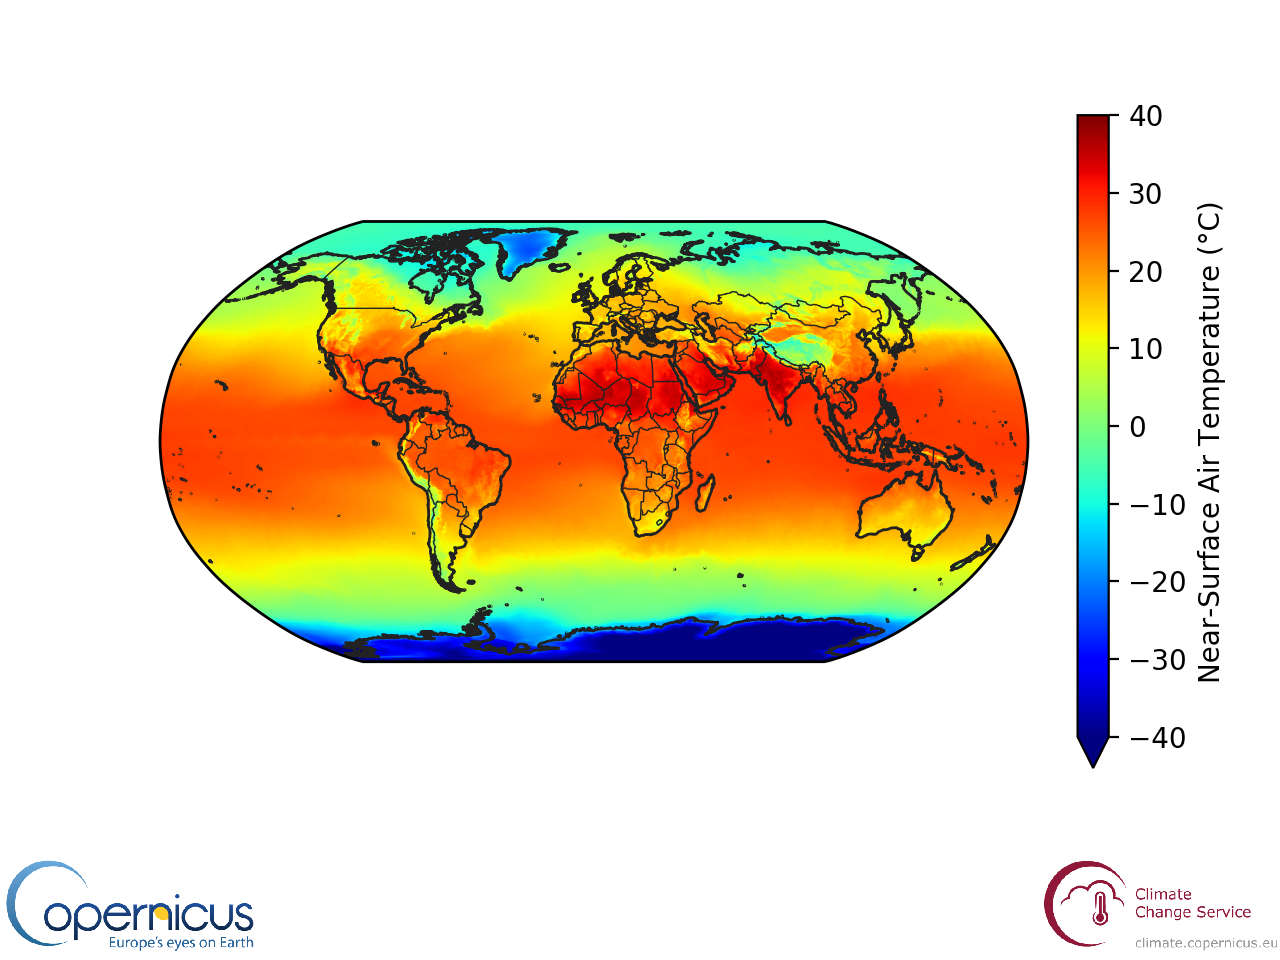
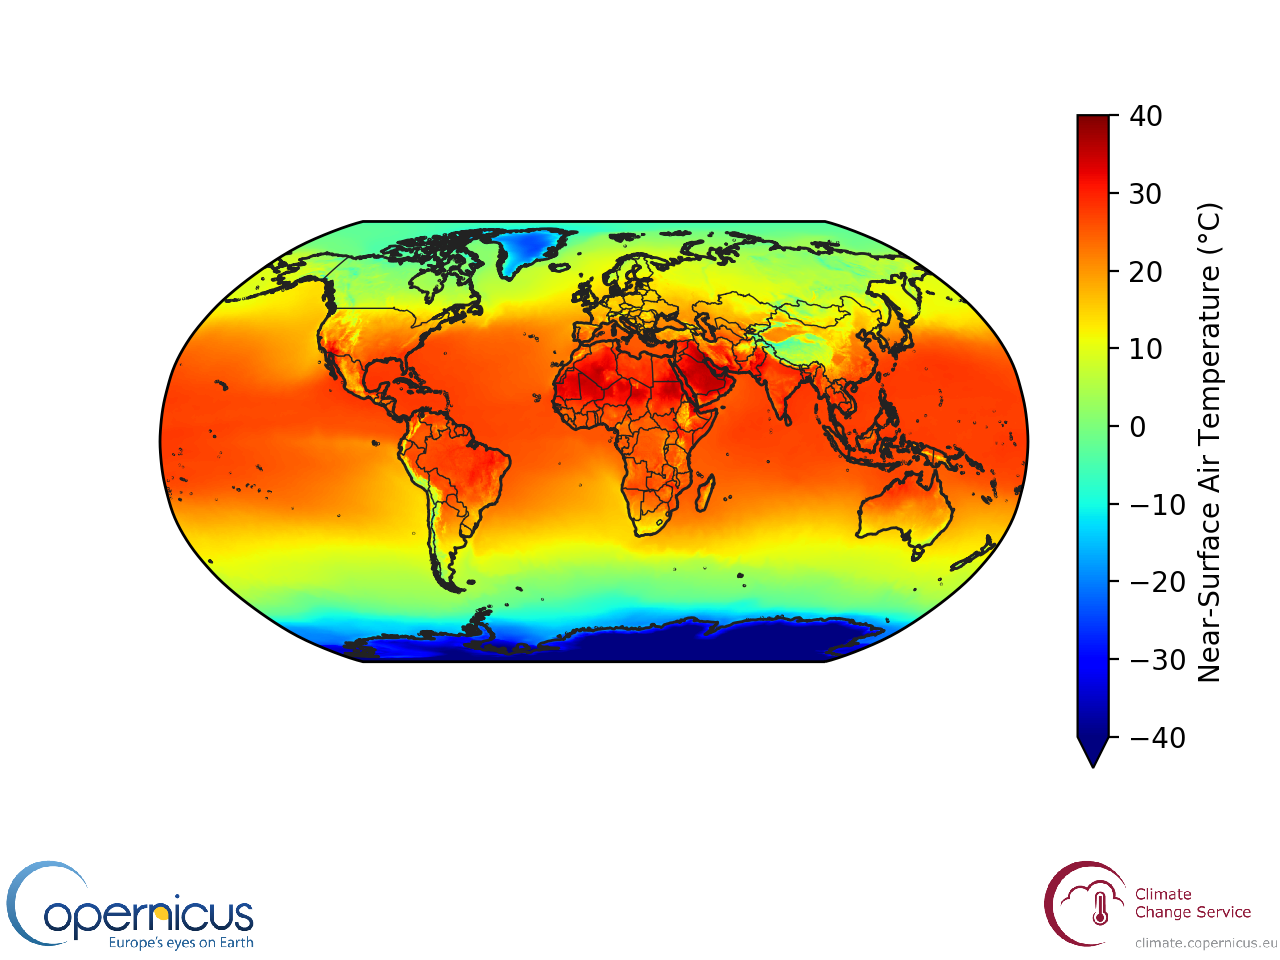
The World's Temperatures in 2018
Most of the time, we see weather data gatehred from dense networks of weather stations, but vast areas of the planet, such as oceans, the polar regions, mountain ranges, and deserts, have few or no weather stations. Yet these areas are often where weather patterns are most interesting! Flip through the temperature maps to see some of these features, such as:
- How much warmer the North Pole was most of the time compared to the South Pole
- In Southern India, summer brought cooler weather thanks to the monsoon
- The winter was remarkably mild in the waters off northern Scandanavia (thanks to the Gulf Stream)