The World's Precipitation in 2018
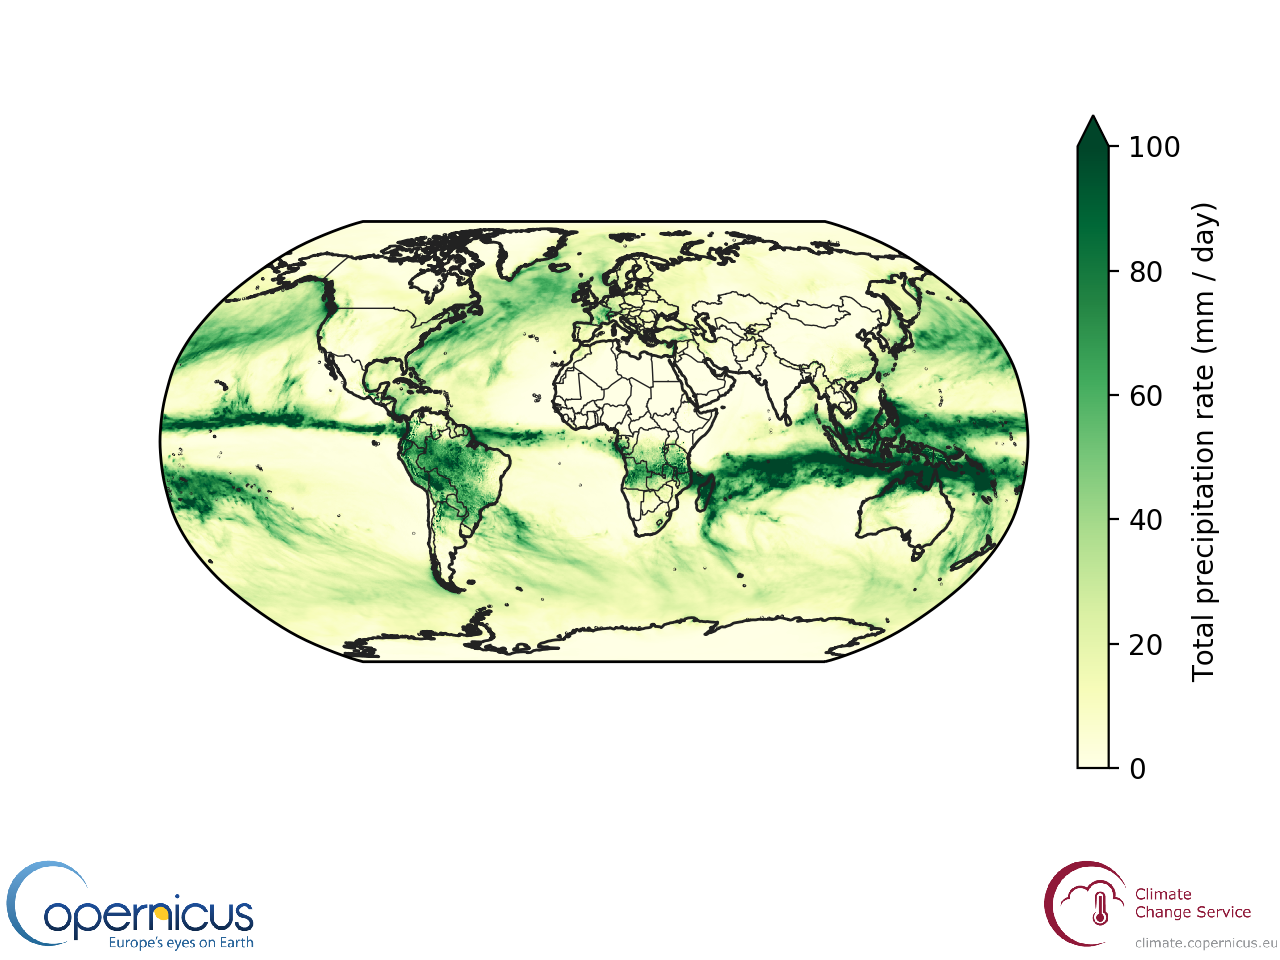
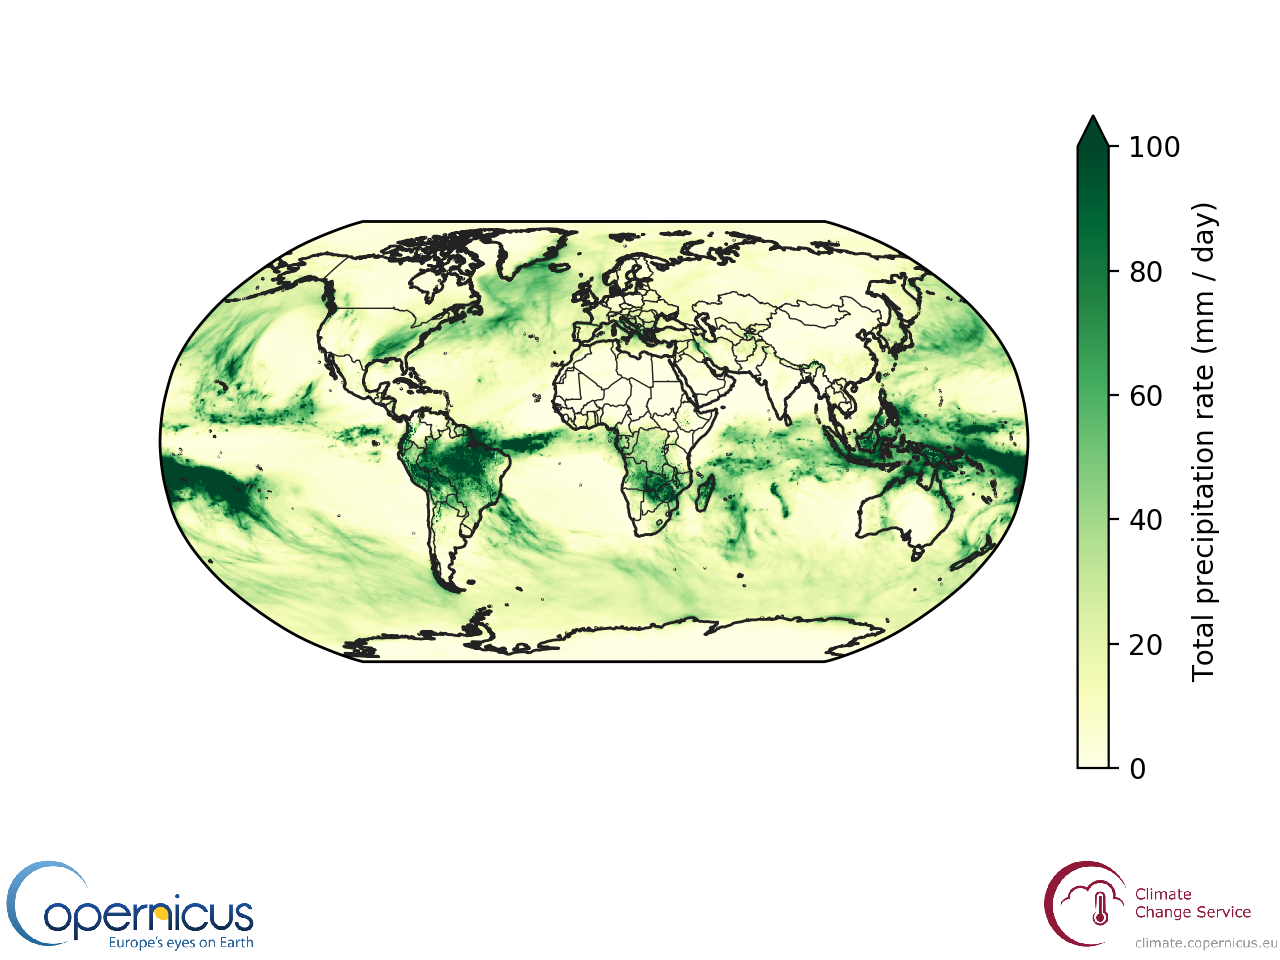
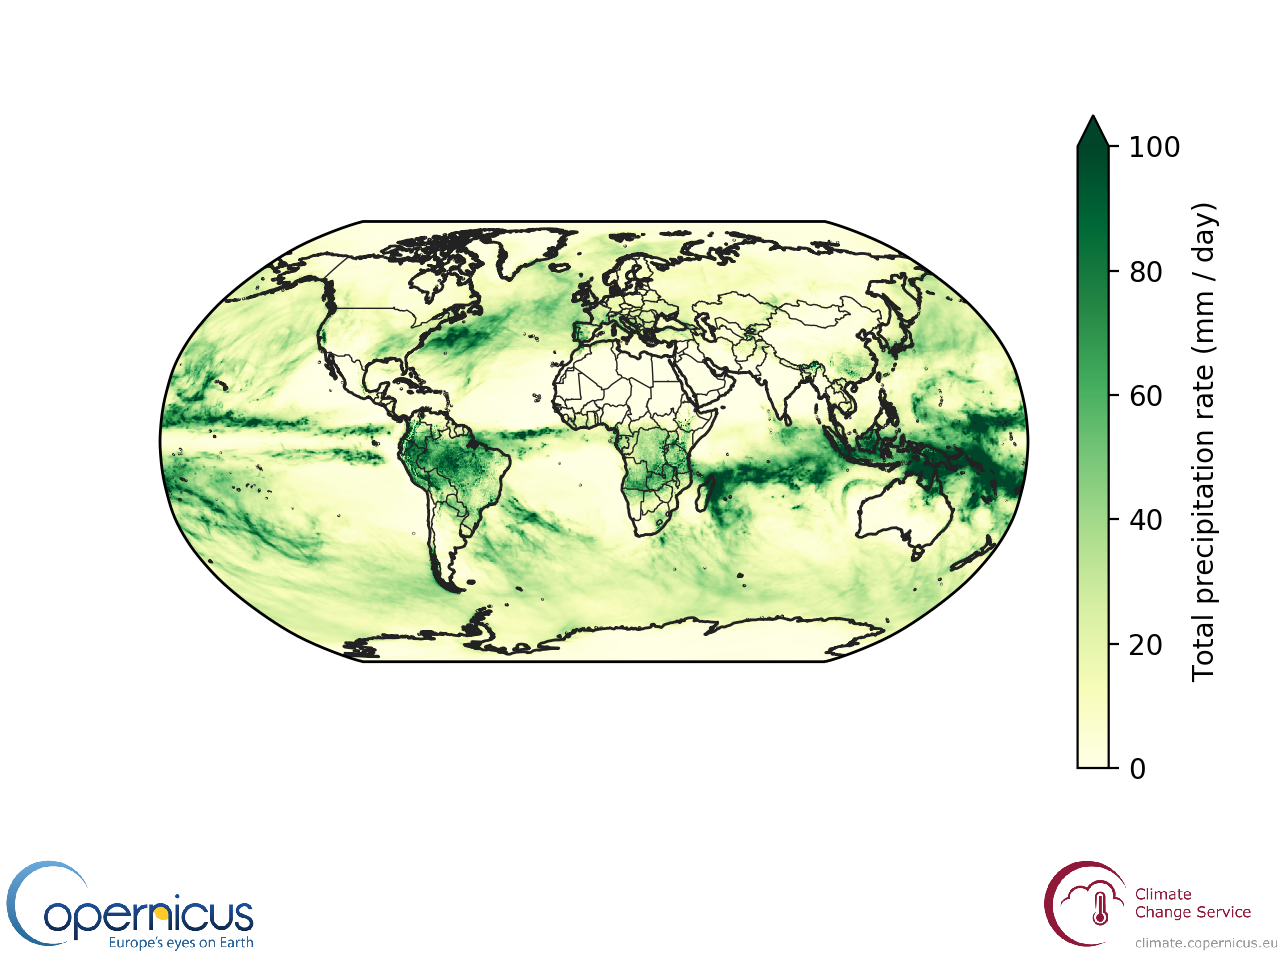
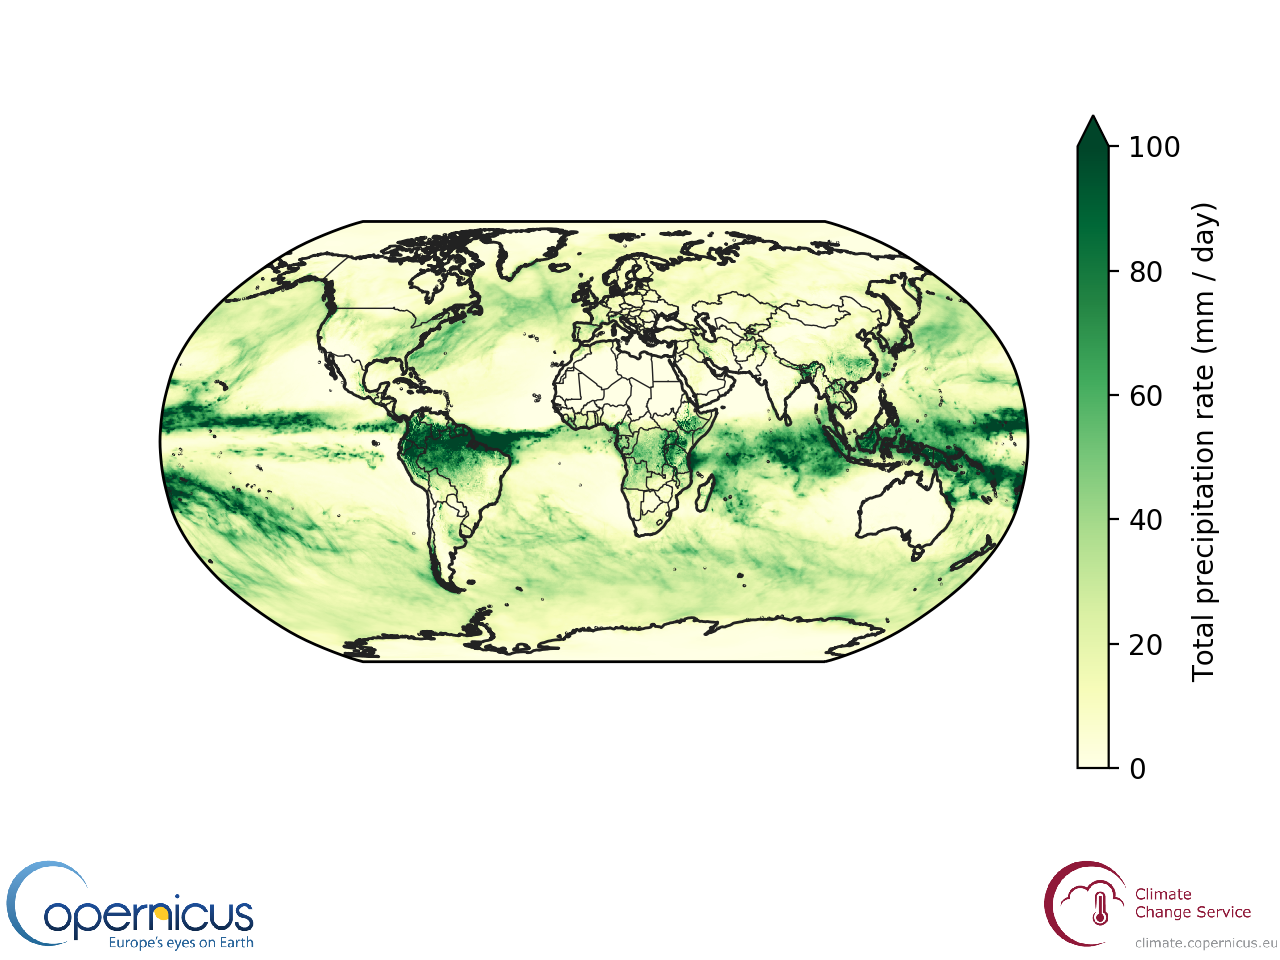
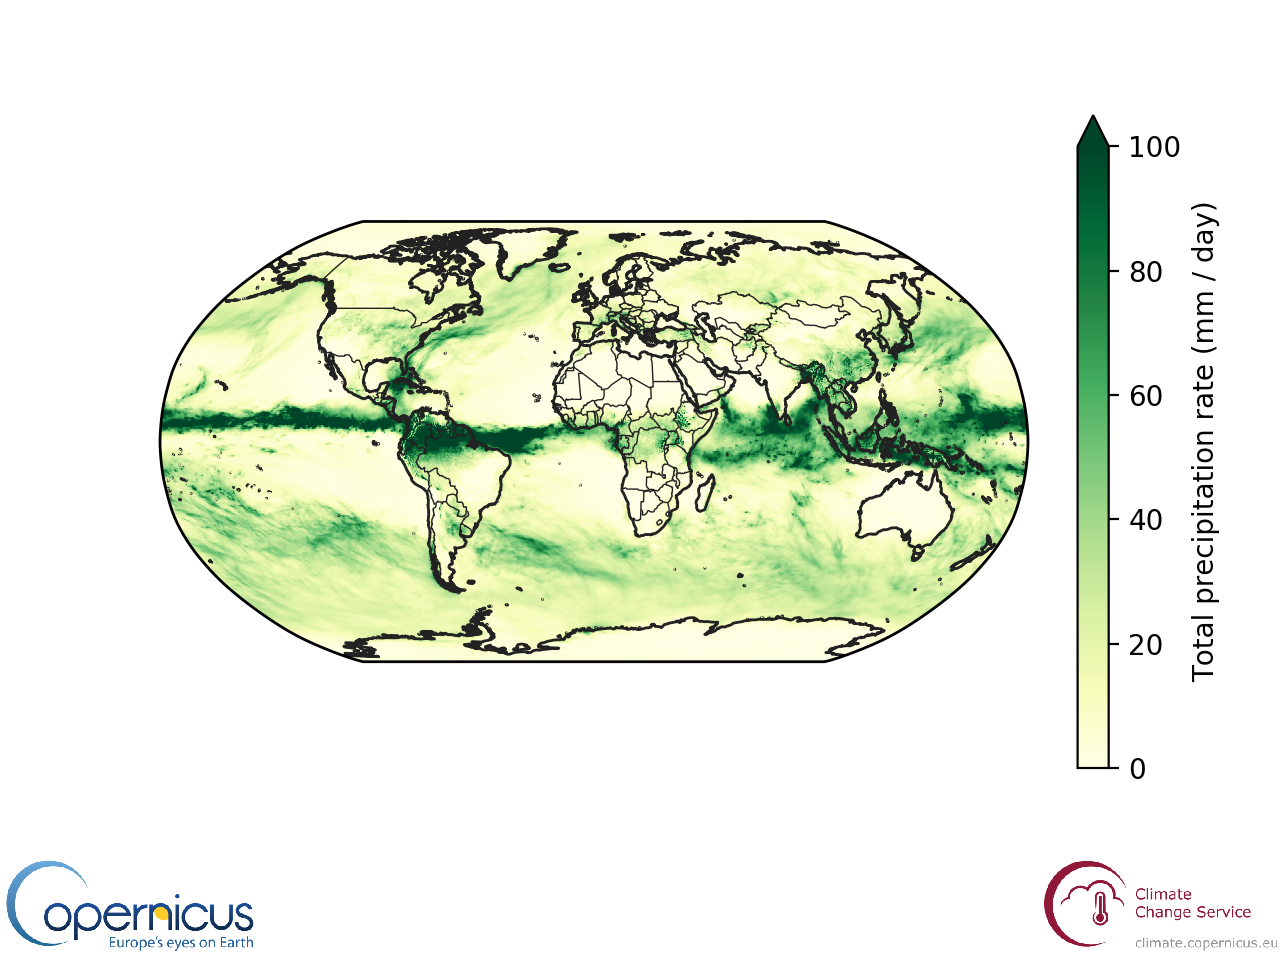
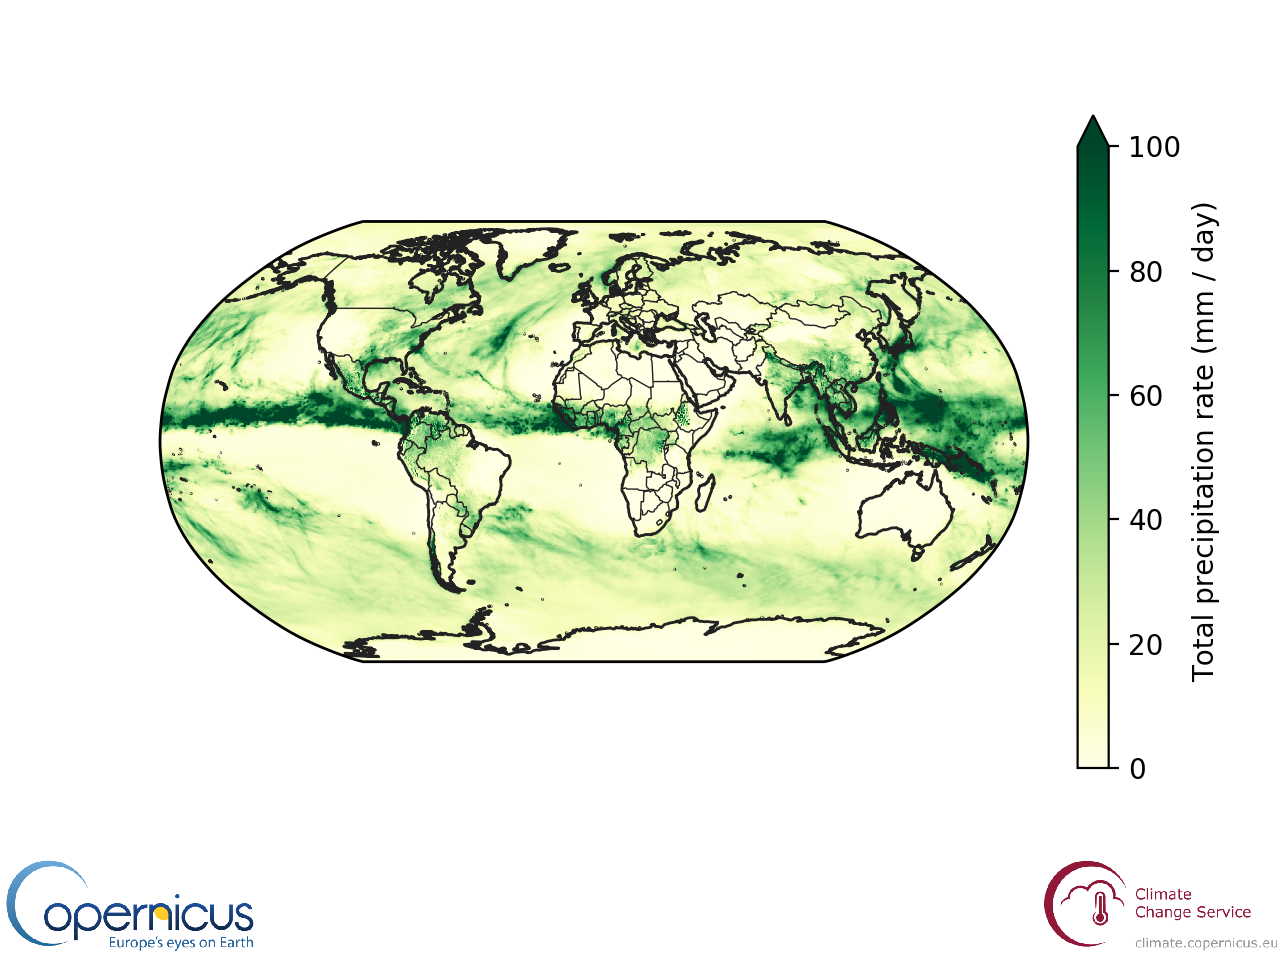
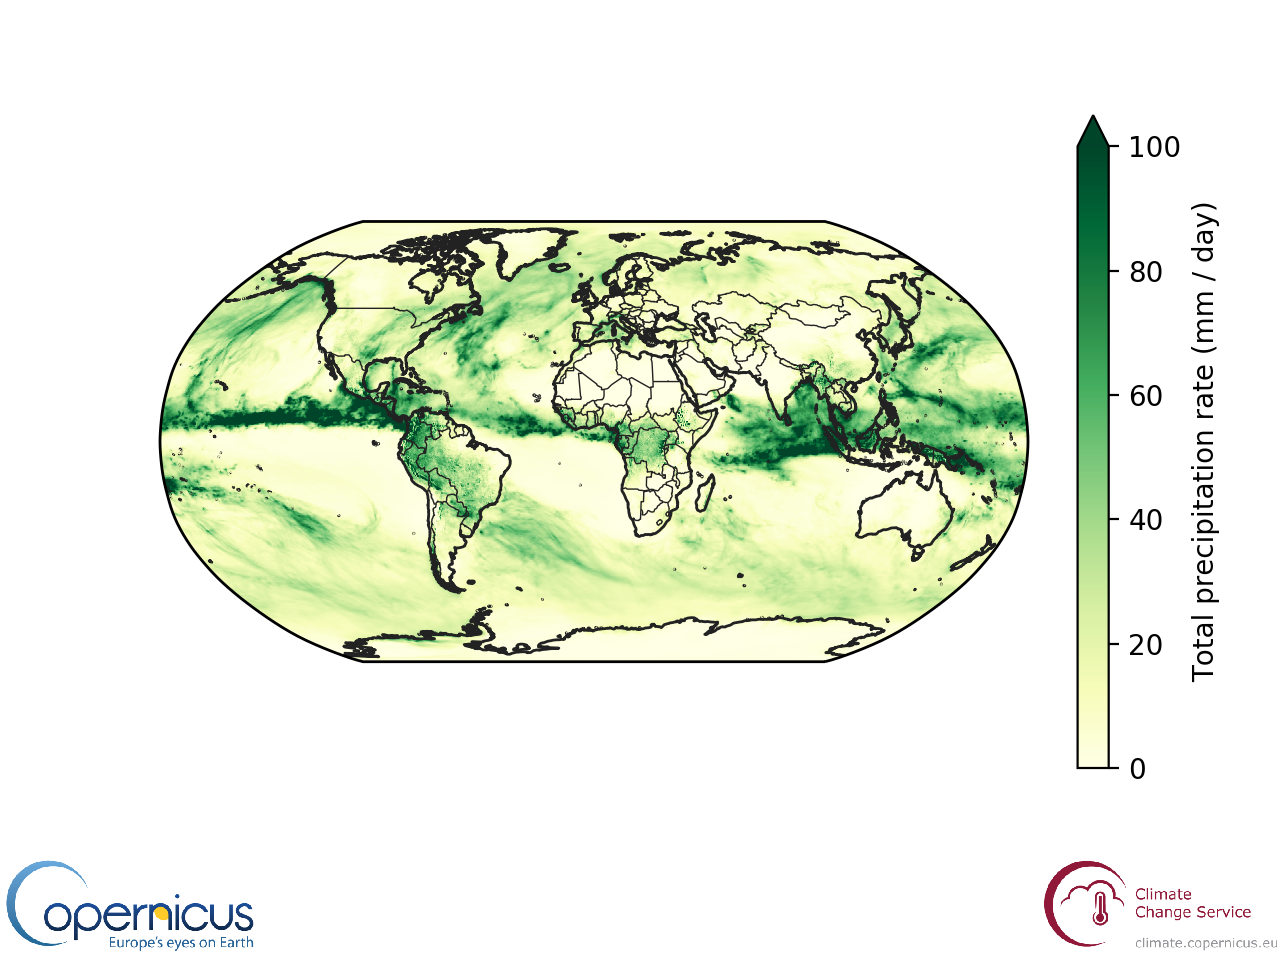
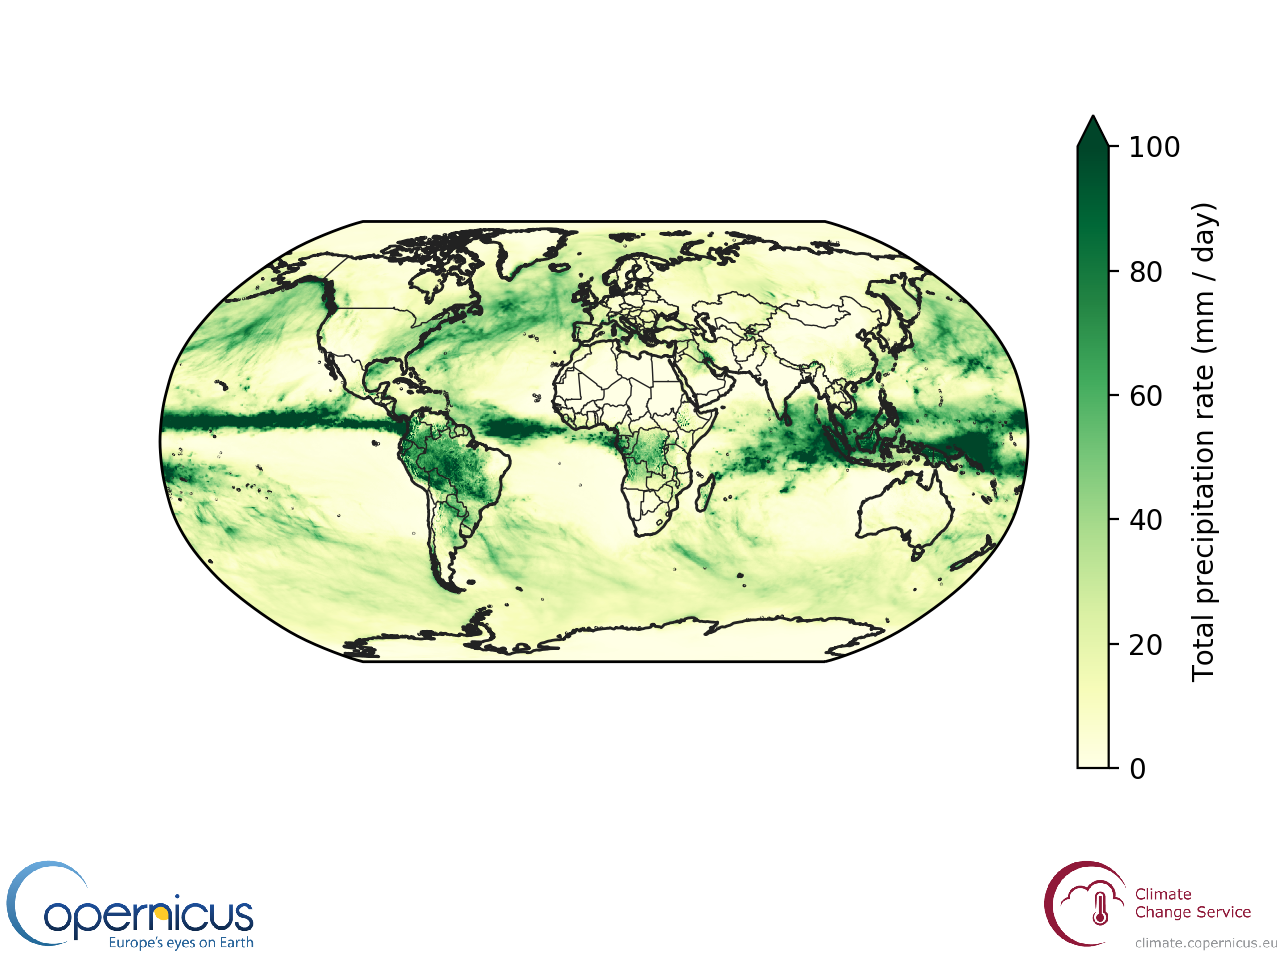
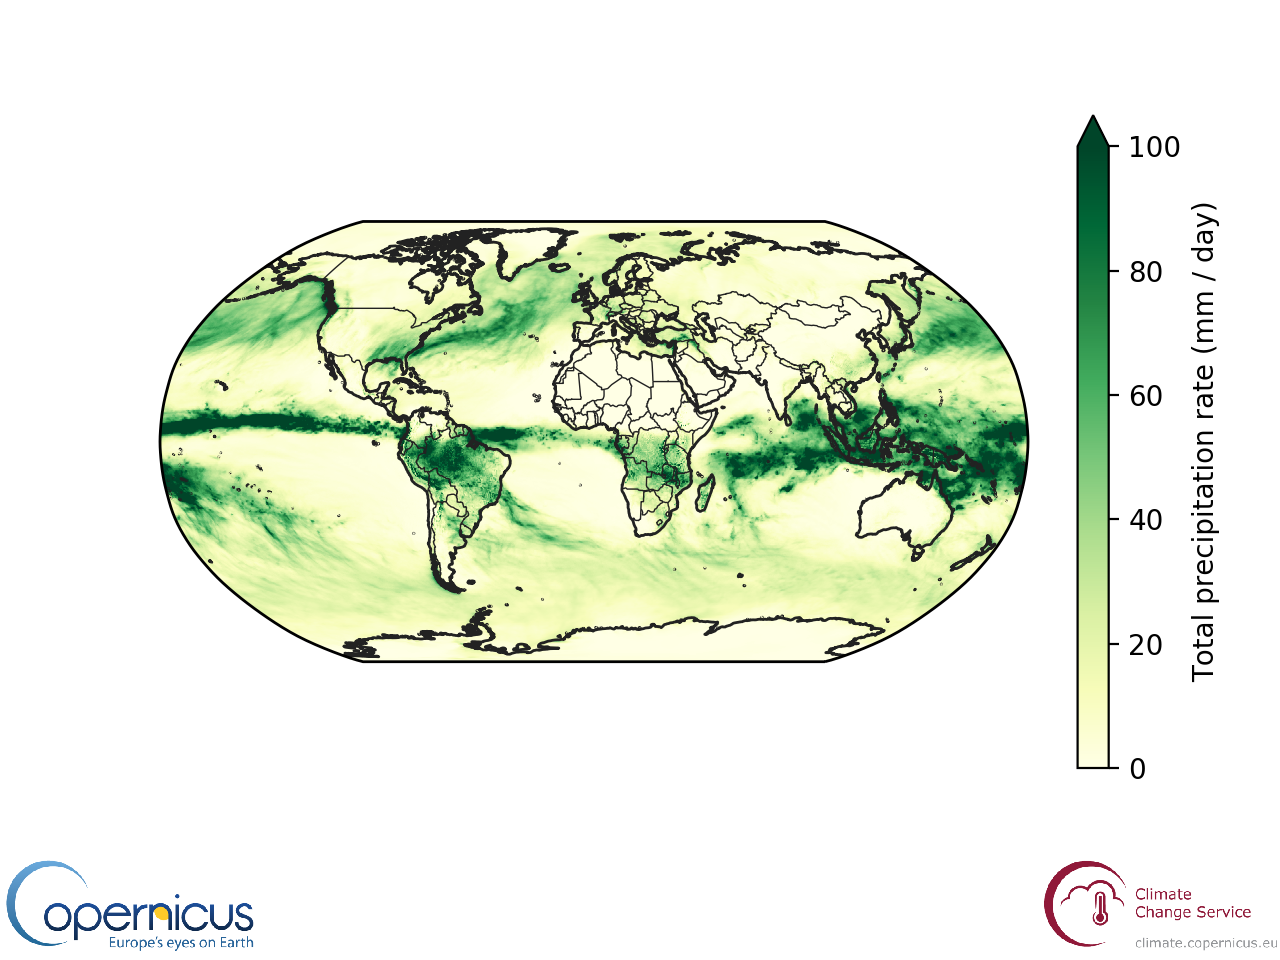
One benefit of viewing nicely gridded data is that many subtle spatial patterns can be resolved, as illustrated with the total precipitation data shown on this page. Click through the 2018 monthly data to see how these features undergo subtle changes over time. You will notice ...
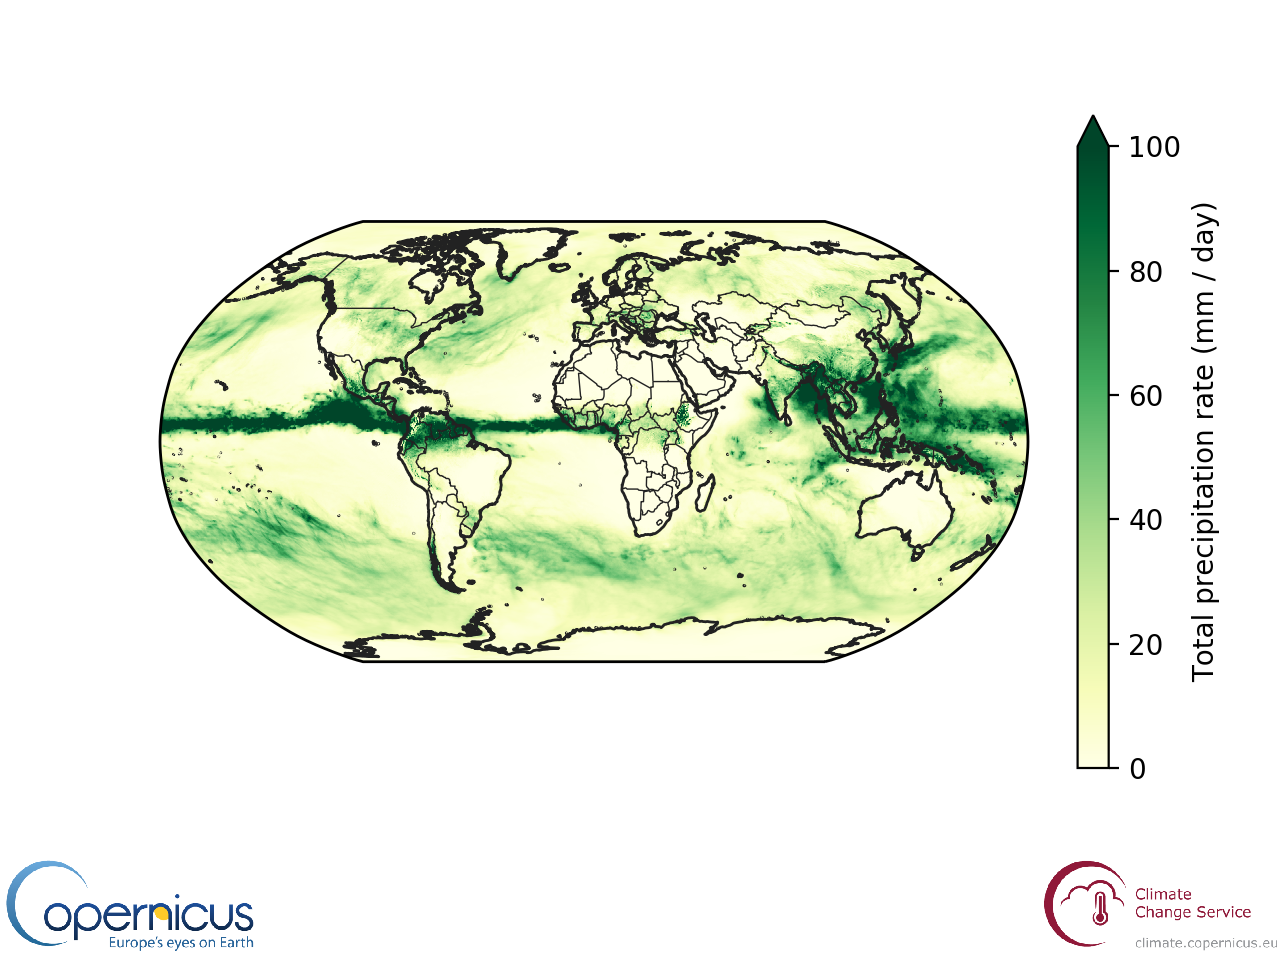
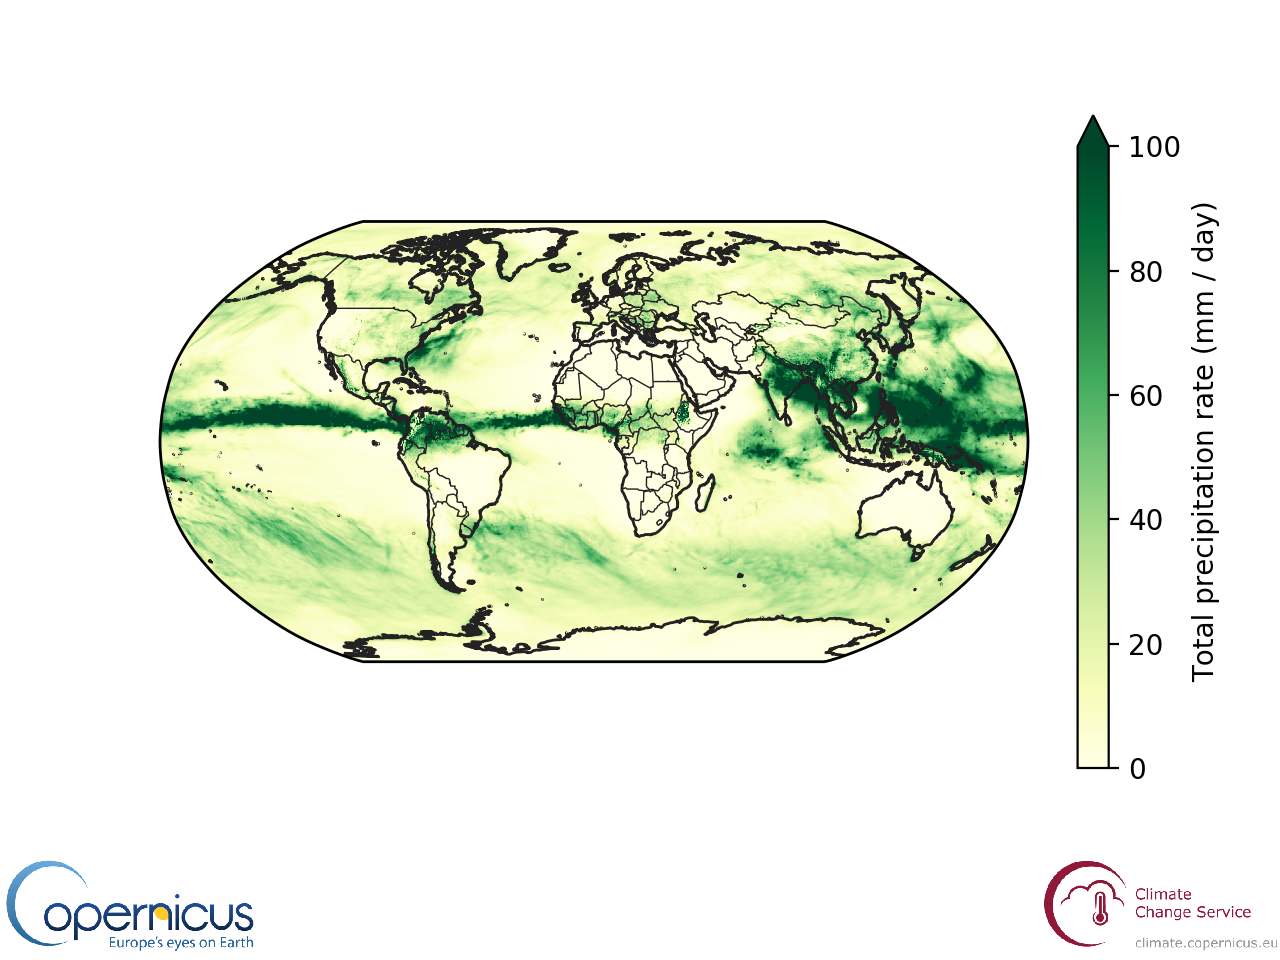
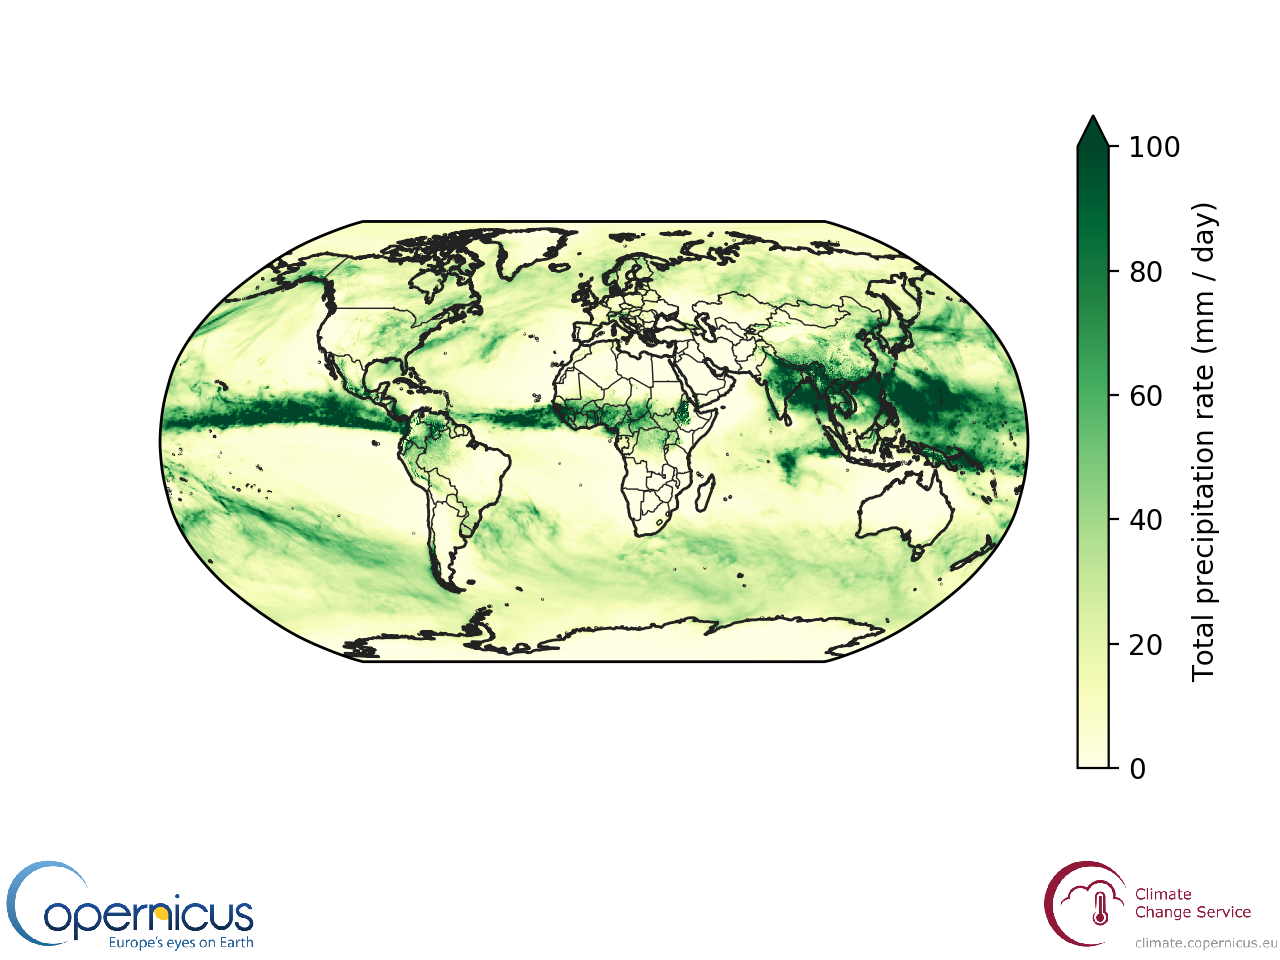
- Precipitation is concentrated in a narrow band that wraps around the equatorial regions (sometimes making more than one complete circle around the planet). This is the Intertropical Convergence Zone
- Precipitation is concentrated along numerous storm tracks along a SW-NE axis in the Northern Hemisphere, but a NW-SE axis in the Southern Hemisphere, reflecting the prevailing wind flow
- In September, an unusually long NW-SE oriented storm track crosses the Atlantic. This storm was Hurricane Florence, which cause massive flooding in the Souteastern United States.